


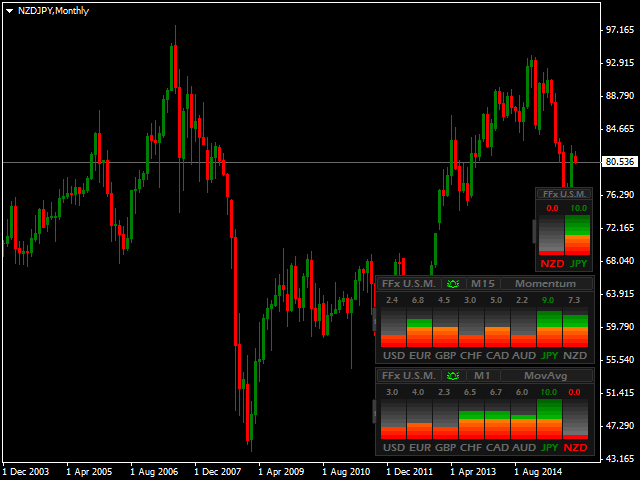

FFx Universal Strength Meter PRO is more than a simple strength meter. Instead of limiting the calculation to price, its values can be based on any of the 19 built-in power measurement modes 9 timeframes. With FFx USM, you can set any period for any combination of timeframes. For example, you can install the panel on the last 10 candles on M15-H1-H4… Full flexibility!
Simple interpretation… This gives a great idea of which currencies are weak and strong, so you can confidently find the best pairs to trade.
Example: If EUR is strong and USD is weak, then you can look for opportunities to enter a long position on the EURUSD chart.
There is also a notification system when certain currencies reach strong or weak levels.
- Dashboard ID: A unique identifier for each copy running on the same chart.
- Strength Mode: Select the mode for calculating the strength level … (Price, Moving Average, MACD, Stochastic, RSI, WPR, Momentum, CCI, ADX, PSAR, DeMarker, AC, AO, Bulls, Bears, Ichimoku, Force Index, OsMA, RVI). Of course, for each indicator, you need to set its own parameters according to your needs. You can switch between modes directly from the chart!
- Strength Period: the number of candles to calculate. You can set any value from 1…
- Strength Timeframes: timeframes for strength. You can combine several timeframes so that the strength value is multi-timeframe (all valid timeframe names are provided in the “Timeframes List” parameters).
- Symbol prefix/suffix: If your broker provides symbols like xxx EURUSD yyy, just add xxx to the “prefix” parameter and yyy to the “suffix”.
- Horizontal/Vertical Shift: Horizontal/vertical offset, specify any number to place the panel anywhere on the chart.
- Strong/Weak Levels: strong/weak levels from 1 to 10, when the levels are reached, an alert is sent (pop-up/sound/mail/push), and the color of the currency changes for clear visualization. Alerts can be enabled/disabled directly on the chart by clicking on the “bell” icon (at least one option for sending alerts must be enabled in the input parameters).
- Minutes Between Alerts: The minimum number of minutes between alerts for each currency.
- Then follow all the standard parameters for standard indicators, similar to the indicators on the MetaTrader 5 platform (see below).
[spoiler title=”Read More…”]
The dashboard can be displayed in compact mode to track only 2 currencies of the current chart. Just click on the left edge of the dashboard as shown in the video.
- Moving Average – Moving Average indicator.
- Period: the period of the moving average
- Shift: shift of the moving average
- Method: Moving average method
- ApplyTo: the type of price for calculating the moving average
- MACD
- FastEMA: the period of the fast EMA of the MACD indicator
- SlowEMA: the period of slow EMA of the MACD indicator
- SignalSMA: SMA period of the MACD indicator
- Applied Price: The price used to calculate the MACD
- Stochastic – stochastic
- KPeriod: the period of the K line of the stochastic oscillator
- dPERIOD: the period of the D line of the stochastic oscillator
- Slowing: deceleration of the stochastic oscillator
- MAMethod: method for calculating the moving average of a stochastic oscillator
- PriceField: The applied price for calculating the stochastic oscillator
- RSI
- Period: RSI period
- ApplyTo: The applied price for calculating the RSI
- WPR
- Period: WPR period
- Momentum – Tempo indicator
- Period: the period of the Momentum indicator
- ApplyTo: the applied price for calculating the Momentum indicator
- CCI
- Period: CCI period
- Applied Price: The price used to calculate CCI
- ADX
- Period: ADX period
- PSAR
- Step: PSAR step
- Maximum: maximum for PSAR
- DeMarker
- Period: period of the DeMarker indicator
- Bulls
- Period: period of the Bulls indicator
- Bears
- Period: period of the Bears indicator
- Ichimoku
- Tenkan sen: Tenkan sen period
- Kijun sen: Kijun sen period
- Senkou span b: Senkou span b period
- Force Index
- Period: Force Index period
- Method: Force Index method
- Volumes: Force Index volumes
- OsMA
- FastEMA: The fast EMA period of the OsMA indicator
- SlowEMA: the period of slow EMA of the OsMA indicator
- SignalSMA: The SMA period of the OsMA indicator
- Applied Price: The price used to calculate OsMA
- RVI
- Period: RVI period
- Period: the period of the moving average
- Shift: shift of the moving average
- Method: Moving average method
- ApplyTo: the type of price for calculating the moving average
- FastEMA: the period of the fast EMA of the MACD indicator
- SlowEMA: the period of slow EMA of the MACD indicator
- SignalSMA: SMA period of the MACD indicator
- Applied Price: The price used to calculate the MACD
- KPeriod: the period of the K line of the stochastic oscillator
- dPERIOD: the period of the D line of the stochastic oscillator
- Slowing: deceleration of the stochastic oscillator
- MAMethod: method for calculating the moving average of a stochastic oscillator
- PriceField: The applied price for calculating the stochastic oscillator
- Period: RSI period
- ApplyTo: The applied price for calculating the RSI
- Period: WPR period
- Period: the period of the Momentum indicator
- ApplyTo: the applied price for calculating the Momentum indicator
- Period: CCI period
- Applied Price: The price used to calculate CCI
- Period: ADX period
- Step: PSAR step
- Maximum: maximum for PSAR
- Period: period of the DeMarker indicator
- Period: period of the Bulls indicator
- Period: period of the Bears indicator
- Tenkan sen: Tenkan sen period
- Kijun sen: Kijun sen period
- Senkou span b: Senkou span b period
- Period: Force Index period
- Method: Force Index method
- Volumes: Force Index volumes
- FastEMA: The fast EMA period of the OsMA indicator
- SlowEMA: the period of slow EMA of the OsMA indicator
- SignalSMA: The SMA period of the OsMA indicator
- Applied Price: The price used to calculate OsMA
- Period: RVI period
[/spoiler]