


Automatic construction and maintenance of Fibonacci levels for selling and buying on any instrument (symbol) and on any period of the chart.
The FiboPlus indicator shows:
- the Fibonacci levels of likely price movements up or down.
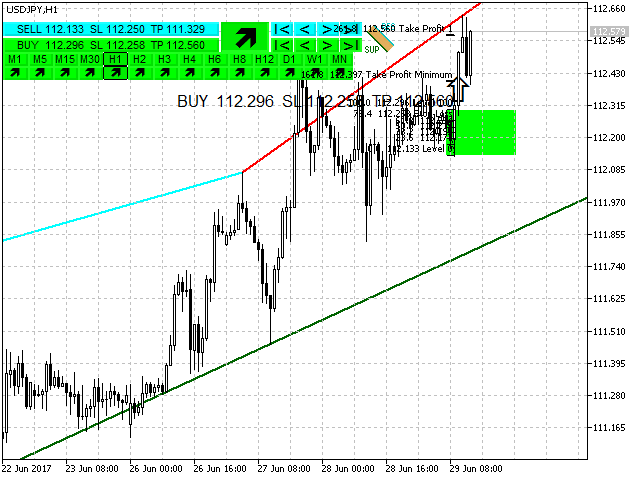
- The entry points are shown by the “up arrow” and “down arrow” icons, and the information is duplicated in the SELL and BUY buttons.
- a rectangular area bounded by levels from 0 to 100. Trade from one level to another (no trend).
- forecast of price movement, market entry points, stop loss and take profit for orders.
- ready-made trading system.
- The control buttons allow you to select one of the Fibonacci options.
- hide the option to sell or buy.
- view other periods of the graph.
- the ” “” – ” keys increase or decrease the graph with automatic recalculation of levels.
- any of the Fibonacci levels.
- any color scheme.
- move the buttons to a convenient location on the chart.
- Language (Russian, English, Deutsch, Espanol, Portugues)
- Options for applying Fibonacci levels:
- Best – for candles of the same color to the first candle of the opposite color,
- Standard – standard build,
- debt of flow – the Market Maker’s flow debt received when strong market distortions are activated
- Color scheme (preset colors):
- White background-for a white background.
- Black background-for a black background.
- Custom background – custom settings for all colors.
- FIBO Custom (value of levels via «,»)
- customcolors: custom color settings
- coordinatesX, Y buttons to snap pixels (X, Y coordinates for snapping buttons to the graph)
[spoiler title=”Read More…”]
- Best – for candles of the same color to the first candle of the opposite color,
- Standard – standard build,
- debt of flow – the Market Maker’s flow debt received when strong market distortions are activated
- White background-for a white background.
- Black background-for a black background.
- Custom background – custom settings for all colors.
- SELL. The option of entering the market for sale. Clicking on the SELL button hides / shows the sell Fibonacci levels.
- |< The first option of entering the market for sale.
- < The previous option of entering the market for sale.
- > The next option is to enter the market for sale.
- >| The last option to enter the market for sale automatic tracking.
- BUY. The option to enter the market to buy. Clicking on the BUY button hides / shows the buy Fibonacci levels.
- |< The first option to enter the market is to buy.
- < The previous option of entering the market to buy.
- > The next option is to enter the market to buy.
- >| The last option to enter the market to buy automatic tracking.
- AUTO. Automatic calculation and support on the market for a new Fibonacci levels on the purchase and sale.
- |< The first option of entering the market for sale.
- < The previous option of entering the market for sale.
- > The next option is to enter the market for sale.
- >| The last option to enter the market for sale automatic tracking.
- |< The first option to enter the market is to buy.
- < The previous option of entering the market to buy.
- > The next option is to enter the market to buy.
- >| The last option to enter the market to buy automatic tracking.
- Sale. The candle closed below the 100th level, stop loss above the 76.4 level, take profit minimum 161.8, take profit 1 – 261.8, take profit 2-423.6.
- Purchase. The candle closed above the 100th level, stop loss below the 76.4 level take profit minimum 161.8, take profit 1-261.8, take profit 2-423.6.
- Purchase/Sell in a rectangular area bounded by levels from 0 to 100. Trade from one level to another (no trend).
- The “debt of flow” option. FiboPlus builds the “debt of flow” levels of the Market Maker, and the price is very likely to return to these levels.
Trade from level 100 to take profit 1-50, take profit 2-33. The second option is to set pending limit orders at the levels of 50% and 33% according to the trend.
It is recommended to update the data before applying the indicator to the current chart of the instrument (by clicking on the periods M1, M5, M15, M30, H1, H2, H3, H4, H6, H8, H12, D1, W1, MN).
It is recommended to update the data before applying the indicator to the current chart of the instrument (by clicking on the periods M1, M5, M15, M30, H1, H2, H3, H4, H6, H8, H12, D1, W1, MN).
[/spoiler]