


The indicator is designed for use on FORTS, but it can also work on other markets, with brokers broadcasting the necessary data.
The peculiarity of this data is that it cannot be requested from the broker’s server as a part of the history, but can only be received as of the current moment.
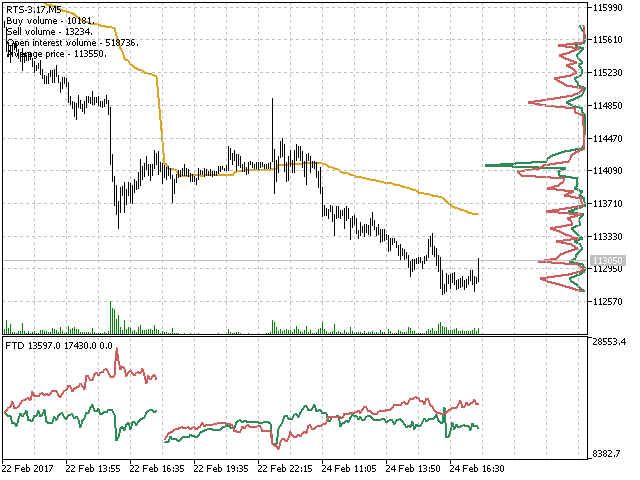
The indicator periodically requests from the broker, accumulates in a file, and displays the following data from the file already historically:
- Weighted average price.
- The volume of purchase orders.
- The volume of sell orders.
- The volume of open positions.
The data is requested once per minute, at the moment when a new candle opens on the M1 timeframe. You can view the accumulated data for any period, including when scrolling the chart to the history.
The indicator does not flicker, and performs calculations and rendering fairly quickly.
The selection of the displayed data is switched using the input variable Data:
- BuyAndSellVolumes – the volume of buy and sell orders.
- OpenPositionsVolume – the volume of open positions.
The weighted average price line is always present on the chart, but if you need to disable the display of this line, set its color to “None”.
The mode of additional calculations is switched using the input variable Calculation:
[spoiler title=”Read More…”]
- None – the data is displayed as is, without processing.
- Delta – the data is displayed as the difference between the values of increments (from candle to candle) of the volume of purchases and sales.
- DeltaOI-data is displayed as the difference between the values of increments (from candle to candle) of the volume of purchases and sales, taking into account the correlation with the increment of the volume of open positions.
- Difference-the data is displayed as the actual difference between the values of the volume of purchases and sales.
Other input variables:
- rowsCount – the number of rows in the profile grid, if the value is zero, the profile is not displayed.
- DisplayCurrentData-enables / disables the text display of the currently requested data.
- BuyLineColor – the color of the purchase volume line (only for the profile).
- SellLineColor – the color of the sales volume line (only for the profile).
- OpenPositionsLineColor – the color of the line of the volume of open positions (only for the profile).
- AveragePriceLineColor – the color of the weighted average price line.
- LinesWidth – the thickness of the lines (for the profile and the weighted average price).
The color and thickness of the indicator lines under the chart can be set in the usual order, in the indicator properties, on the “Colors” tab.
The indicator requires a stable internet connection. When the connection with the broker’s server is disconnected, “gaps” appear in the indicator readings. The accumulated data is saved as binary files in the terminal folder…MQL5/Files/FTD.
Please note!!! Due to the specified features of the data used, the indicator does not draw in the test mode, but only displays the information requested at the moment in text.
[/spoiler]