


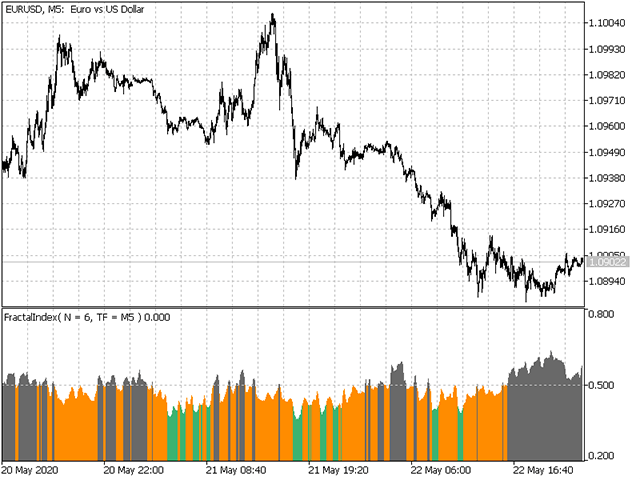

The Hurst Fractal Index is an indicator of the persistence of a time series
If the indicator value is >0.5, the time series is considered persistent (the trend persists)
When the indicator values are explicitly < 0.5 the time series is considered anti-persistent (possible change of direction of movement)
For clarity, the index values are averaged over a period of 2-3.
Indicator Settings:
- Max Bars – the depth of the calculation history (the number of bars on the chart for which the calculation was made)
- Data from Timeframe – use data from the timeframe.
- Degree of dimension ( 4…12 )- the dimension value
- Level Reverce – level for displaying possible trend change zones
- Method – method for smoothing the index value
- MA period – smoothing period
[spoiler title=”Read More…”]
The Hurst Fractal Index is an indicator of the persistence of a time series
If the indicator value is >0.5, the time series is considered persistent (the trend persists)
When the indicator values are explicitly < 0.5 the time series is considered anti-persistent (possible change of direction of movement)
For clarity, the index values are averaged over a period of 2-3.
Indicator Settings:
- Max Bars – the depth of the calculation history (the number of bars on the chart for which the calculation was made)
- Data from Timeframe – use data from the timeframe.
- Degree of dimension ( 4…12 )- the dimension value
- Level Reverce – level for displaying possible trend change zones
- Method – method for smoothing the index value
- MA period – smoothing period
[/spoiler]