


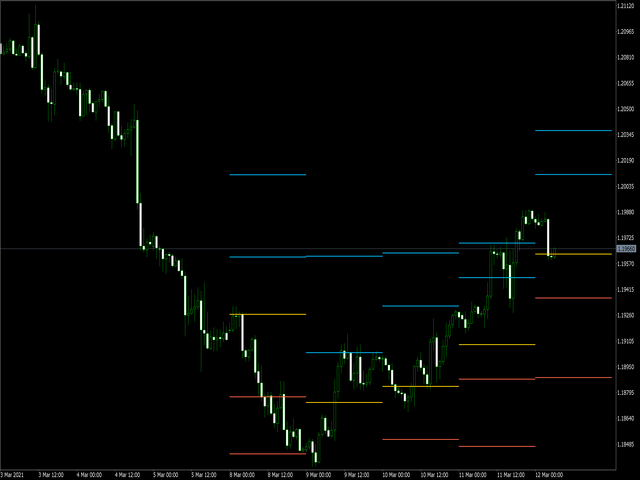

The utility draws the reversal levels according to the formulas for each of the selected number of candles:
On any timeframe.
After closing a new candle on the calculated timeframe, the levels of the last day are removed.
That is, the chart always shows up-to-date data for the selected period.
It is possible to disable the levels. Except for the main one-Pivot