


Do you use support and resistance levels?
Do you want to find them quickly and automatically?
Do you want to define them by your own parameters?
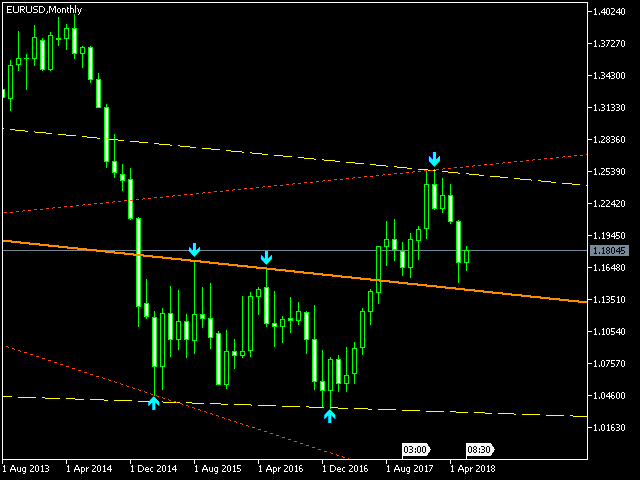
The Lines indicator is designed to search for support and resistance lines on the chart. It works quickly and automatically.
The main principle of the algorithm is to search for all extremes on the graph (in accordance with the Density parameter). The indicator then tries to find at least 3 points (according to the “Minimum count of points” parameter) that can be used to calculate the support or resistance line. Then a linear regression algorithm is used to plot the lines.
- Density – the density of the search for extremes. The higher the value, the lower the sensitivity, and vice versa. The base unit is 1 bar of the chart.
- History – the depth of the history to search for. At -1, the indicator searches for all bars in the history. The base unit is 1 bar of the chart.
- Range – the range of the search for support and resistance lines from the found extremes. The base unit is 1 bar of the chart.
- Minimum count of points – the minimum number of extremum points for drawing lines.
- Maximum deviation – the maximum allowable deviation. Base units-in %.
- Color, width, style of lines-adjust the color, thickness, and style of lines
- Prolong lines to future-continuation of lines to the future
- Show points of lines-display on the chart the points on which the lines are drawn
- Color of points – point colors
- Your own prefix for object-prefix for object names when using multiple lines
[spoiler title=”Read More…”]
The resulting line is plotted as a linear regression from all the points found.
[/spoiler]