


The Moving Average Convergence Divergence indicator is a dynamic trend-following indicator. This indicator is based on an innovative algorithm developed by BJF Trading Group.
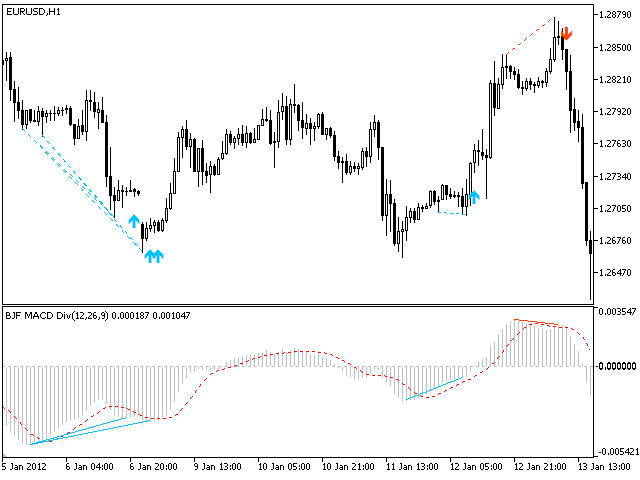
Divergences are displayed on the price and indicator charts. The indicator arrows appear when a new bar appears, the indicator is not redrawn, and you can trade using these signals. Moreover, the indicator is never late! The analysis is carried out on the completed bars, the arrows of the trading signals (shown above/below the prices) never disappear.
The occurrence of a divergence between the MACD and the price indicates a high probability of the current trend ending soon. The buy signal is the formation of a new down-fractal below the previous fractal, while the values of the MACD indicator for the corresponding bars are higher. The signal to sell is the appearance of a new fractal up (Up-fractal) above the previous one, while the MACD values are lower.
The MACD Divergence indicator has many settings.
Hidden bullish divergence occurs when the price reaches a new high and the values of the oscillator form a new low. Such situations occur in the case of an uptrend. When the price has reached a new high, you need to check the indicator values. If the values of the oscillator have not formed a new high, then this is one of the cases of hidden bullish divergence.
[spoiler title=”Read More…”]
Hidden bearish divergence occurs when the price has formed a new low, while the oscillator has formed a new high. Such cases occur in a downward trend. With a hidden bearish divergence, there is a high probability that the price will fall further and the downtrend will continue.
[/spoiler]