


The Market Grid View utility replaces the standard Market Overview window. The utility allows the user to quickly switch between symbols with a single click, view price changes or recent transactions.
To use the utility, include the necessary symbols to the Market Overview, and then you can close the Market Overview. Then run the utility on the chart.
Configure the settings:
- Columns: number of columns to display
- ShowInfo: type of information to display
- the value of the last trade on the symbol
- price change from close
- price change from the last trade during the last session
- price change from opening
- the value of the last trade on the symbol
- price change from close
- price change from the last trade during the last session
- price change from opening
The change in the price from the close is considered as:
- 100*(last – close)/close
- close – the value of the last trade on the last day. This is a commonly used method of measuring price changes.
Price change from the last trade during the last session:
- 100*(last – last_session_trade)/last_session_trade
Price change from opening:
- 100*(last – open)/open
- Useful for day traders who do not leave positions overnight.
[spoiler title=”Read More…”]
After installing the Market Grid View, all symbols will be displayed in the grid.
The background color for each character field is set according to the “ShowInfo” parameter to evaluate the color. If the price change is 10% or more, the maximum color (green or red) will be set, otherwise the proportional color will be set.
Even when using LAST in the information field, the background is still set based on the price change from the last trade during the last session.
When you click on the field, the corresponding graph will be displayed.
There is a limit of 200 characters, because the computer I used for testing has a memory limit, so I was not able to test more than 200 characters. If you need more characters, please email me.
It was tested only on the Brazilian Stock Market (BOVESPA) and Forex trading.
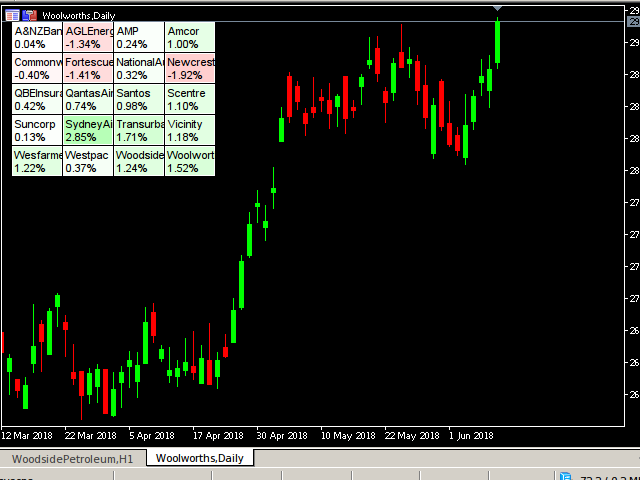
The utility can be used as a heat map. When you configure the associated symbols, the grid will turn into a heat map. Let’s say we need to track all the oil-related stocks. We group all the symbols associated with oil — and this will serve as a heat map.
Or check the Australian Stock Market. Then select the symbols from Australia in the symbols window (ctrl M) and get a heat map of Australia. See screenshots.
Or, let’s say we want to find out which section of the Brazilian Stock Exchange is trading best today. We configure the symbols separately by sections. For example, in the first two lines of the screenshot on iBovespa, we can see how the banks work. See screenshots.
[/spoiler]