


The OandaX product series is designed to display additional data on orders and positions provided by the Oanda FxLabsservice .
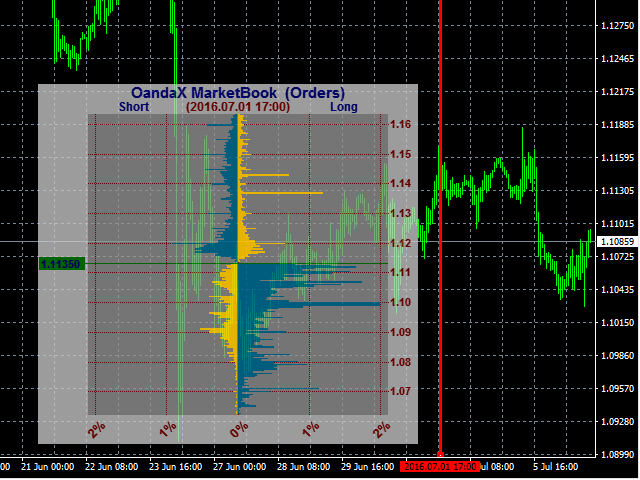
The OandaX OrderBook ImageHistory indicator is designed to display the historical histogram of orders or positions for the instrument that is closest in time to the moment specified by the user on the chart. To constantly update the data, it is necessary that the OandaX Download Manager Expert Advisor works in the terminal. To display the already downloaded data, the presence of a working Expert Advisor is not necessary.
- Order Book (OrderBook) or Open Orders. This is a histogram that shows the distribution of limit and stop orders by price levels. Limit orders include Buy Limit orders and Take Profit levels. Stop orders include Sell Limit orders and stop ordersStop Loss.
- Book of positions or Open Positions. This histogram shows the distribution of prices at which the active positions of traders were opened at the time of the formation of the histogram
The above information is available for 16 instruments: AUDJPY, AUDUSD, EURAUD, EURCHF, EURGBP, EURJPY, EURUSD, GBPCHF, GBPJPY, GBPUSD, NZDUSD, USDCAD, USDCHF, USDJPY, XAUUSD, XAGUSD.
[spoiler title=”Read More…”]
The minimum step of historical data is 20 minutes, but depending on the depth of the history, the step can increase to 1 day, and there may also be unexpected omissions.
There are four display formats available for both histograms (orders and positions)
- basic; displays the basic histogram by level without additional processing
- cumulative; the values of all previous levels are added to each level
- the difference is simple; instead of short and long orders(positions) displays the difference between them
- cumulative difference; difference for a cumulative histogram
The data is downloaded and stored in UTC time, so to correctly display the time of the histogram, you need to specify the correct time shift of your broker’s server relative to UTC in the indicator properties
- Use Custom Instrument-Trueif you have very non-standard instrument names or you need to display the histogram of another instrument on the chart;
- Custom Instrument Name – the name of the instrument in the Oanda FxLabs format. For EURUSD–EUR_USD, for Gold, XAUUSD – XAU_USD, for Silver, XAGUSD – XAG_USD;
- Server UTC Time Offset – the offset of your server’s time relative to UTC
- Show Histogram Cumulative – if True, a cumulative histogram is drawn, i.e. the values of the previous levels are added to each subsequent level;
- Show Histogram Difference – if True, the difference histogram is shown, i.e. for the horizontal level, the difference between the sales and purchases is shown, not the levels of sales and purchases. It also works for cumulative mode.
- Show Orders (Positions if False) – if True, the histogram of orders is shown, if False, the histogram of positions is shown, i.e. the distribution by levels of the prices at which the current positions were opened.
- Always show latest available information – if True, shows the most up-to-date histogram, otherwise shows the histogram closest in time to the pointer line.
[/spoiler]