


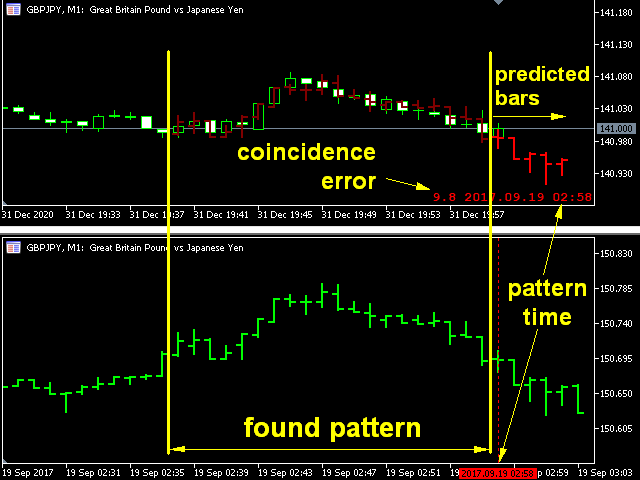

The indicator predicts the nearest bars of the chart based on the search for up to three most suitable patterns (a sequence of bars of a given length) in the history of the current instrument of the current timeframe.
The found patterns are combined with the current pattern at the opening price of the current (last) bar. The predicted bars are the bars immediately following the patterns found in the history.
The pattern is searched once at the moment of opening of each new bar of the current timeframe. During the formation of the bar, the indicator is not redrawn.
In the lower right corner of the chart, the matching error (in points) and the time of the found pattern are indicated in the corresponding color. The match error is calculated as the square root of the averaged sum of the squared deviations of all OHLC prices of all pattern bars.
The indicator can be useful for predicting market behavior and making decisions on trading operations.
[spoiler title=”Read More…”]
In order for the indicator to find the most exactly matching patterns, it is necessary to provide as much depth of the history of the bars as possible.
- Pattern length – the length of the pattern (a positive integer), i.e. the number of matching bars of the desired pattern.
- Count of predicted bars – the number of predicted bars (a positive integer).
- Search for patterns-an enumeration type parameter with the values one_best_coincided, two_best_coincided, three_best_coincided, which allows you to set the number of the most suitable patterns in the history to be searched for (up to three).
- Visualization mode of prediction–an enumeration type parameter with the values show_bars_only, show_big_candle_only, show_big_candle_and_bars, which allows you to set the prediction visualization mode as only bars, only a large candle (for Count of predicted bars > 1) , or bars and a large candle at the same time (>see screenshots below).
- Show patterns – a Boolean parameter (true/false) indicating the need to show the found patterns.
- History depth to search patterns (0 – all available) – the depth of the history (the number of recent bars) used to search for patterns. If the parameter is set to 0, the entire available bar history is used. Keep in mind that increasing the depth of the history increases the search time for patterns.
- A set of parameters for setting the colors and line widths that are used to build large candlesticks. By default, the predicted bars are displayed in lighter tones relative to the colors of the corresponding patterns. The line thicknesses used to plot the bars of all three patterns are set to a single fixed value of 2.To display the full shape of the bars of all three patterns, you can set different line thicknesses (for example, 1, 3, 5) (see screenshots).
- 1st best pattern-the most suitable pattern found with the lowest error matching the current pattern. Indicator buffers 10-14 are used to build the pattern bars;
- 2nd best pattern – the second most suitable pattern with the next largest matching error with the current pattern (indicator buffers 5-9);
- 3rd best pattern – the third most suitable pattern with the highest error of matching the current pattern among the three found patterns (indicator buffers 1-4).
[/spoiler]