


The indicator displays the lot size and stop levels for long and short positions, using the information on the chart and the set input parameters. The volume of the position is determined based on the percentage of volatility calculated by the ATR. The indicator is suitable for traders who want to master more advanced methods of determining the volume of a position, other than the fixed lot method.
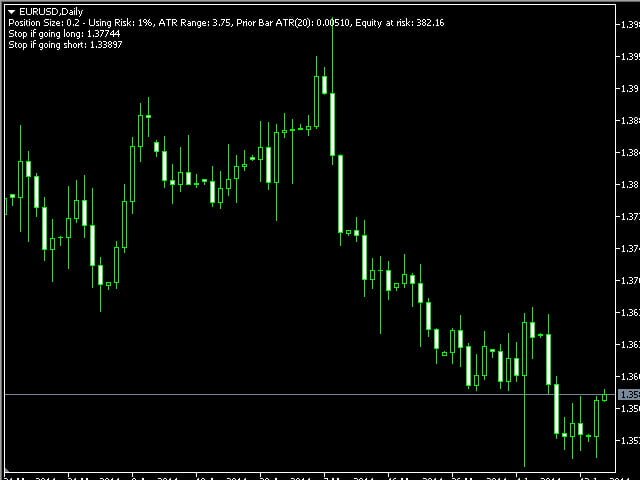
The text with the necessary information is added directly to the chart and includes the calculated position volume, the percentage value of the risk used, the value of the input parameter ATR Range, the value of the ATR from the previous bar, the value of the equity exposed to risk when closing a stop position (spreads, gaps and slippage are not taken into account), as well as stop levels when opening long and short positions.
You can change the input parameters to adjust the risk value, the number of bars in the ATR, and the ATR interval. Input parameters:
- Risk_percent – the amount of risk used in the calculation. If you want to risk 1%, enter 1 for this parameter. If you want to set the risk to 1.75%, enter 1.75.
- ATR_Periods-bars for calculating ATR.
- Stop_Range_ATR – the number of multipliers to create an ATR interval or stop level around the price. If the parameter value is too small, you will get more false signals when the stop level is close. If the value is too high, the stop level may be too far away. As a result, the position volume will be too small for the trade to be profitable.
[spoiler title=”Read More…”]
The percentage value of volatility (%Volatility Position Size) takes into account the volatility, equalizes or normalizes positions regardless of the currency pair, and reduces losses using the built-in stop. You can easily determine the required position size based on the risk value you set. The calculation uses the value of each tick on the chart. The value is calculated if the price reaches the stop level. Based on this value, the position volume is limited based on the amount of risk you set. As the volatility increases, the allowable position volume displayed on the chart decreases. As the volatility decreases, the displayed position volume increases. In addition, the displayed position volume increases if your account size increases based on the acceptable risk value you set, and decreases if your account is experiencing a drawdown.
Generalized calculation formula: (Funds at risk / ((ATR distance/Tick size) * Tick value))
The calculation results are rounded down to match the Lot Increment size.
Attention:
- If the ATR value is too small (for example, on the M1 or M5 charts), the position volume will be larger than expected and you will need to increase the value of the input parameter ATR Range.
- Only one indicator can work on the chart at a time, using the function of displaying a comment in the main window.
[/spoiler]