


The test results showed the share of profitable trades from 75% and above, depending on the trading instrument.
This indicator is developed by a team of professional traders. The algorithm is based on the Dow Jones theory, which describes the behavior of prices in financial markets, and has proven its profitability in practice.
The trendexpert indicator is designed to accurately predict the price movement of any trading instrument, and works in three trading modes:
- SCALPING — Short-term trend (M1-M15)
- DAY-TRADING-Medium-term trend (M30-H1)
- SWING TRADING — Long-term trend (H4-D1)
You can apply any of these modes, according to your trading style, on any timeframe, and get an accurate forecast of price movement.
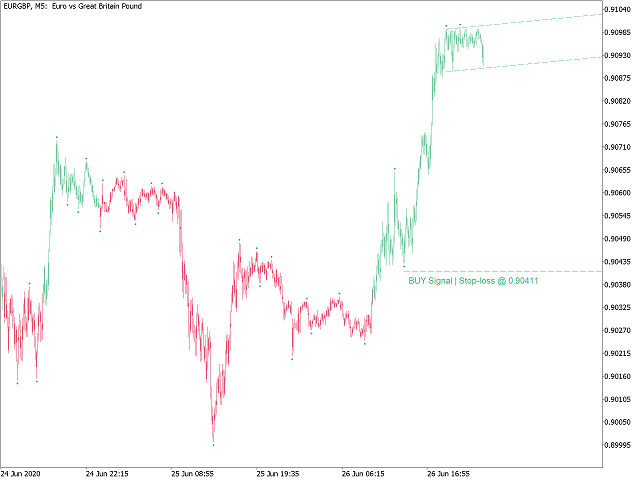
- Easy to use. Always shows the current and accurate trading signal – BUY or SELL. You just have to open a deal!
- Automatically builds a linear channel for easy visualization of the trading signal
- Does not redraw, even on the zero bar
- Always shows the stop-loss price for risk management purposes
[spoiler title=”Read More…”]
The indicator is fully automated. You do not need to understand the complex algorithm of the indicator – just follow the trading signals on the chart!
The indicator automatically determines key support and resistance levels, trend strength and volatility, taking into account the current market situation, which provides the most accurate trading signal.
The trendexpert indicator accurately shows the reversal points and identifies the trend. And determining the trend is the most important thing in trading.
Using the indicator is very simple:
? You need to BUY when the indicator is green and shows the BUY signal
? You need to SELL when the indicator is red and shows the SELL signal
? You need to BUY when the indicator is green and shows the BUY signal
? You need to SELL when the indicator is red and shows the SELL signal
trendexpert is a fully automated indicator. The logic of its work is that an uptrend is when the price goes to higher highs and higher lows, and each subsequent correction does not go below the previous low. Similarly, a downtrend is when the price updates new lows and lower highs, and each subsequent correction does not go above the previous high. This is what the Dow Jones trend definition theory says.
As soon as the correction breaks through the local extreme, it is considered that there has been a trend change (position reversal). Thus, we always clearly identify the current trend as uptrend or downtrend. This is a fundamental logic that definitely works. There are no difficulties, as always in life. Finding the optimal parameters that will provide an accurate definition of extremes, skipping false ones and not missing the real ones is very difficult. Volatility is also a factor.
The current parameters are those that our team has selected by the optimization method over a long period, which show the correct trend on different timeframes in 80% of cases. That is, you already have a fully automated tool that will show the right direction in 80% of cases!
This indicator is the result of more than a decade of practical trading experience in the currency, cryptocurrency and stock markets.
Since the publication of the indicator in 2013 — more than 7 years ago-this indicator has become an indispensable tool for many traders, and in practice has proven its accuracy.
We wish you successful trading,
The Trend Expert Team
[/spoiler]