


The PipTick Pivot indicator automatically calculates and displays pivot levels and support and resistance levels. Pivots can be calculated using the following formulas: Classic, Floor, Fibonacci, Woodie, Camarilla, or DeMark. It is also possible to select the period for calculating the indicator. You can choose a daily, weekly, monthly, or custom period.
- Classic.
- Floor.
- Fibonacci.
- Woodie.
- Camarilla.
- DeMark.
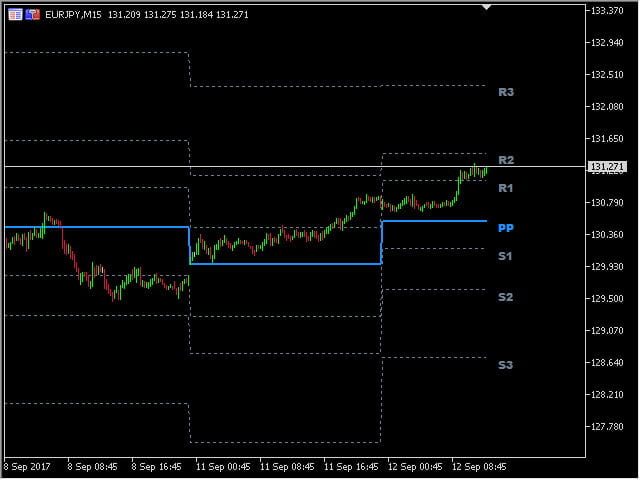
- The indicator shows the current and historical pivot levels.
- Pivot-support and resistance levels.
- Pop-up alerts along the indicator lines.
- User session time.
- It works on all timeframes (M1, M5, M15, M30, H1, H4, D1, W1, MN).
- The indicator does not redraw.
- Ready for testing.
- Configurable parameters (color, line thickness, visibility…).
- Very fast calculations.
- Designed for MT4 and MT5.
- Pivot_Method-select the formula to calculate: Classic, Floor, Fibonacci, Woodie, Camarilla, or DeMark.
- Session_Mode – Session mode: Daily( daily), Weekly( weekly), Monthly (monthly) and Custom (custom).
- Session_Start_Hour – the session start time, if the custom session time mode is set. Otherwise, the parameter is ignored.
- Session_Start_Minute – the minute of the session start, if the user session time mode is set. Otherwise, the parameter is ignored.
- Session_End_Hour – the end hour of the session, if the custom session time mode is set. Otherwise, the parameter is ignored.
- Session_End_Minute – the minute of the end of the session, if the custom session time mode is set. Otherwise, the parameter is ignored.
- Sessions_Back – the number of displayed sessions. If the value is zero, all sessions are displayed.
- Text_Size – the size of the text at the indicator levels.
- Visibility_Line_Description – enable/disable the display of the description lines.
- Visibility_PP-enable / disable the display of pivot levels.
- Visibility_R1-enable / disable the display of the first resistance line.
- Visibility_R2-enable / disable the display of the second resistance line.
- Visibility_R3-enable / disable the display of the third resistance line.
- Visibility_S1-enable / disable the display of the first support line.
- Visibility_S2-enable / disable the display of the second support line.
- Visibility_S3-enable / disable the display of the third support line.
- Color_PP – the color of the pivot levels.
- Color_R1 – the color of the first resistance line.
- Color_R2 – color of the second resistance line.
- Color_R3 – the color of the third resistance line.
- Color_S1 – the color of the first support line.
- Color_S2 – the color of the second support line.
- Color_S3 – the color of the third support line.
- Alert – enable / disable alerts when the price touches one of the indicator lines.
- Alert_Sound-select an audio file for alerts.
[spoiler title=”Read More…”]
- PP – the value of the pivot level.
- R1 – the value of the first resistance level.
- R2 – the value of the second resistance level.
- R3 – the value of the third resistance level.
- S1 – the value of the first support level.
- S2 – the value of the second support level.
- S3 – the value of the third support level.
[/spoiler]