


PipTick Supply Demand is the best indicator ever created by us. This great tool automatically draws the supply and demand zones that are the best places to open and close positions. It has many advanced features, such as: support for multi-timeframe zones, displaying the width of zones, notifications when zones are touched again, and many others. Due to the principle of market fractality, this indicator can be used for any type of trading. It doesn’t matter if you are trading on positions, swings, or intraday. PipTick Supply Demand is suitable for everyone, including scalpers.
The only reason why the price moves in the market is the imbalance of supply and demand. The greater the imbalance, the stronger the movement. Understanding where the supply and demand zones are located gives you a significant advantage when trading.
An offer is the amount of currency that someone wants to sell at a certain price (price zone). The offer is a stack of orders that need to be removed from the path before you can move to a higher level. On the other hand, if this currency supply cannot be bought by market participants, then the price will start to fall. The PipTick Supply Demand indicator indicates the supply zones in purple.
[spoiler title=”Read More…”]
Demand is the amount of currency that someone wants to buy at a certain price (price zone). Demand is a stack of orders that need to be removed from the path before you can move to a lower level. On the other hand, if this demand for currency cannot be bought by market participants, then the price will start to rise. The PipTick Supply Demand indicator indicates the demand zones in green.
- The indicator shows supply and demand
- Simple forecast turning points in the market
- Two methods for calculating zones
- Support for multi-time frame zones
- Notice when you re-touch zones
- Displaying the width of the zones
- Works on all timeframes (M1, M5, M15, M30, H1, H4, D1, W1, MN)
- Customizable parameters (colors, text size, zone visibility, periods …)
- Excellent results together with analysis of price action and candle patterns
- An ideal tool for all types of trading (Scalpers, intraday traders …)
- Very fast calculations
- It can be used to create Expert Advisors
- Designed for MT4 and MT5
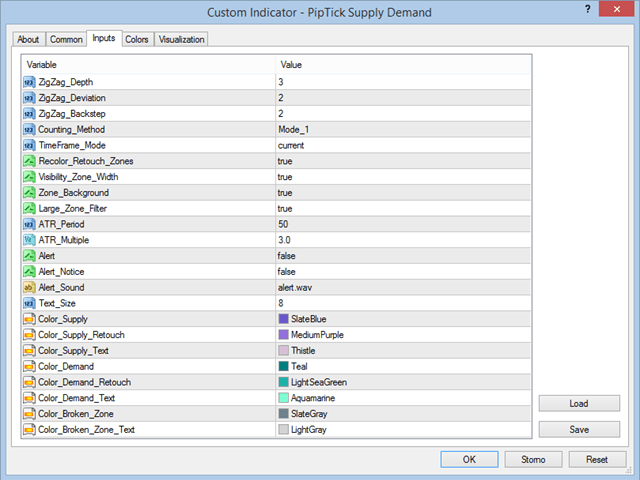
- ZigZag_Depth-Depth for calculating ZigZag
- ZigZag_Deviation-Deviation for calculating ZigZag
- ZigZag_Backstep – Backstep value for ZigZag calculation
- Counting_Methods-Select one of two methods for calculating zones
- TimeFrame_Mode – select the timeframe for the calculation of supply and demand
- Recolor_Retouch_zones-enables or disables the zone re-touch function
- Visibility_Zone_Width-enables or disables labels that show the width of zones
- Zone_Background-enables or disables the background of the zone rectangle
- Large_Zone_Filter-enable or disable the ATR large zone filter
- ATR_Period – Period for calculating ATR
- ATR_Multiple-Multiplier for calculating the large zone filter
- Alert-Enables or disables notifications when zones are tapped again
- Alert_Notice-Enables or disables the display of the alert window when the zones are touched again
- Alert_Sound-Enables or disables sound notifications when the zones are touched again
- Text_Size – The size of the text of the zone labels
- Color_Supply – Color of the rectangle of the offer zone
- Color_Supply_Retouch – Color of the rectangle of the repeated touch of the offer zone
- Color_Supply_Text – Color of the offer zone label
- Color_Demand – Color of the demand zone rectangle
- Color_Demand_Retouch – Color of the rectangle of the repeated touch of the demand zone
- Color_Demand_Text – Color of the demand zone label
- Color_Broken_Zone – Color of the rectangle of the broken zone
- Color_Broken_Zone_Text – Color of the broken zone label
- PipTick SD-Indicates the touch of the demand or supply zone. If the bar touches the offer area, the result is 1. If the bar touches the demand zone, the result is 2. If none of the conditions is met, the value is empty.
- PipTick SD High-Shows the maximum of the touch zone
- PipTick SD Low-Shows the minimum of the touch zone
- PipTick ZigZag-Shows ZigZag peaks
[/spoiler]