


The PipTick VWATR indicator is a useful tool for measuring market activity. It is based on the idea of volume-weighted ATR. The combination of these two elements helps to determine possible turning points or convenient moments for a breakout. The indicator uses a moving average and its coefficients to classify market activity. Accordingly, the area where the VWATR bar is located (relative to the moving average) is marked as ultra-low, low, medium, high, very high, or ultra-high. The PipTick VWATR indicator is presented as a histogram.
This indicator calculates the moving average in four ways:
- SMA-Simple Moving Average
- SMMA-Smoothed Moving Average
- EMA-Exponential Moving Average
- LWMA-Linear-weighted moving average
By default, there are six user-configurable zones. The bar of the histogram is colored in a certain color, depending on which zone corresponds to the VWATR.
- Ultra-low VWATR zone-crimson color
- Low VWATR zone – White color
- Medium VWATR zone-turquoise color
- High VWATR zone – Dark sky blue
- Very High VWATR Zone-Royal Blue
- Ultra-high VWATR zone – Blue
- Simple classification of market activity
- Multiple calculation methods to choose from
- Calculation of real and tick volume
- The zone ranges are selected by the user
- Works on all timeframes (M1, M5, M15, M30, H1, H4, D1, W1, MN)
- Fast and reliable indicator
- Configurable parameters (color, line thickness, period MA…)
- It can be used to create an Expert Advisor
- Designed for MT4 and MT5
[spoiler title=”Read More…”]
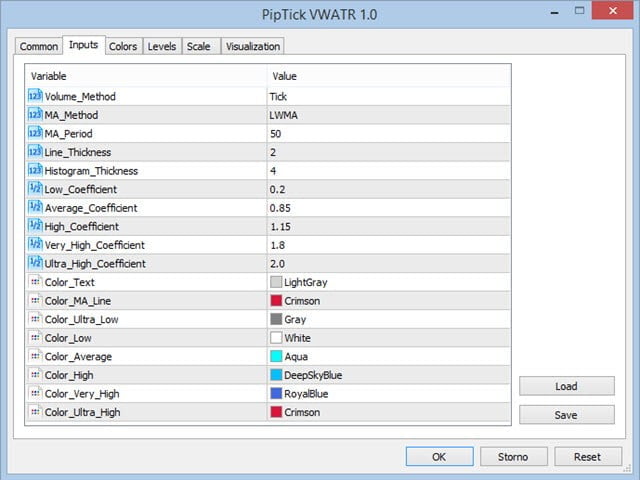
- Volume_Method – Selecting the tick or real volume for calculations
- MA_Method-Moving Average, SMA, SMMA, LWMA, and EMA method
- MA_Period – The period for calculating the moving average
- Line_Thickness – The thickness of the output line
- Histogram_Thickness – The thickness of the output histogram
- Low_Coefficient-Coefficient for determining the low zone
- Average_Coefficient-Coefficient for determining the average zone
- High_Coefficient-Coefficient for determining the high zone
- Very_High_Coefficient-Coefficient for determining a very high zone
- Ultra_High_Coefficient-Coefficient for determining the ultrahigh zone
- Color_Text – The color of the indicator text
- Color_MA_Line – Color of the moving average line
- Color_Ultra_Low – The color of the ultra-low histogram
- Color_Low – Color of the low histogram
- Color_Average – Color of the average histogram
- Color_High – The color of the high histogram
- Color_Very_High – The color of a very high histogram
- Color_Ultra_High – The color of the ultra-high histogram
- Average VWATR – Displaying the average VWATR value for the period
- VWATR- Displaying VWATR values
- Type – Displays the zone type number. 1-6 corresponds to the zones. Number 1 means ultra-low, 6 means ultra-high
- Low – Display of low zone values. Otherwise, the value is zero
- Average – Displaying the values of the middle zone. Otherwise, the value is zero
- High – Displaying high zone values. Otherwise, the value is zero
- Very High – Displays the values of a very high zone. Otherwise, the value is zero
- Ultra High – Displays the ultrahigh zone values. Otherwise, the value is zero
For more information, visit the PipTick VWATR page.
[/spoiler]