


The Price Action Strength indicator uses the available market data in its purest form (price action) and uses it to determine the strength of the market movement. Reading a price action and measuring its strength are subjective factors, and it will take years to master this skill. The purpose of this indicator is to make the reading of the strength of the price action as objective as possible.
This is a much more advanced indicator compared to standard oscillators, because in addition to the price movement and its direction, the Price Action Strength indicator analyzes the movement characteristics. This allows you to see the market through the eyes of an experienced price action trader.
The new version of Price Action Strength uses the same values as version 1.0, but version 2.0 is able to determine the mood of market participants. There are 2 possible moods:
- Forecast/reversal sentiment, which is calculated based on the latest price peaks/troughs compared to the Price Action Strength value;
- The continuation/momentum mood, which is calculated based on the momentum and the Price Action Strength value.
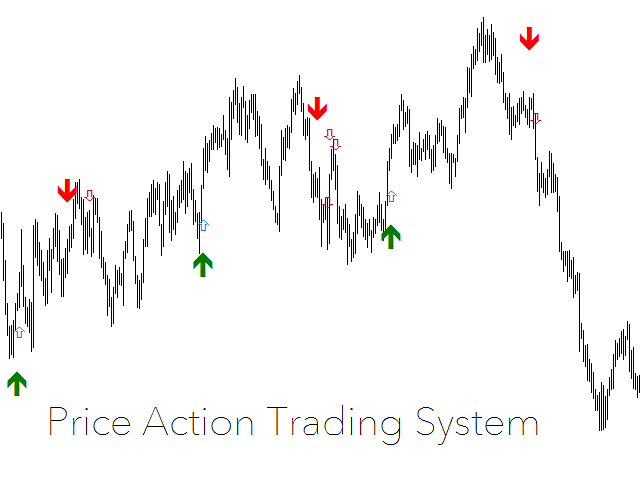
In the new version, this sentiment definition is used to generate arrows on the chart that show the likely direction of future market movement solely based on price action analysis.
[spoiler title=”Read More…”]
The new version has 3 types of arrows/buffers (one for each direction) in addition to the 2 buffers that were present in version 1.0:
- The Strength buffer calculates the relative strength of the price action compared to the specified number of past bars (Period). The information is visualized using a line in a separate window. The upward movement of this line indicates the bullish strength of the price action, the downward movement indicates the bearish strength of the price action. The higher this line, the more bullish the price action strength is, the lower the line, the more bearish the strength is;
- The overlap buffer ‘Overlap’ calculates the relative overlap of the current bars compared to the specified number of past candlesticks (Period). The information is visualized as a histogram. The higher the histogram, the stronger the strength of the price action, taking into account the overlap of the bars. In other words, the higher the histogram, the less overlap there is between the bars, which means that the price has a specific direction, it does not fluctuate, which indicates a strong movement;
- The reversal buffer ‘Reverse’ is indicated by a thin up/down arrow. The reversal arrow indicates that a price reversal is likely. Reversal signals produce the most false signals, but if they are correct, they predict the strongest movements. When trading on these signals, it is recommended to use a risk-to-profit ratio of at least 2;
- The ‘Continuation’ buffer is indicated by a slash arrow. The continuation arrow indicates that the market is gaining momentum in the corresponding direction. These signals often occur during the current trend. They are intended to be used as an auxiliary indication that the market is likely to continue moving in the current direction. Continuation signals provide the most accurate forecasts, but the market movements that follow them are often small. It is recommended to use these signals for increasing trades on the trend or for scalping;
- The ‘Confirmation’ buffer is indicated by a thick up/down arrow. The confirmation arrows are displayed when the reversal and continuation signals appear on the same candle at the same time. This indicates a very likely movement.
Note! All arrows appear at the opening of the candleon which they are located, and do not redraw!
Note! All arrows appear at the opening of the candleon which they are located, and do not redraw!
The indicator arrows can be used as an independent trading system, that is, you can make trades when the arrows appear. You can also use the arrows to determine market sentiment, as price action analysis provides a fairly accurate forecast of the likely future direction of the market.
Price Action Strength 2.0 works on all symbols and timeframes, but it is recommended to use it on higher timeframes (H4 and higher), because the principles of price action analysis work better on higher timeframes.
- ‘Period‘ – the number of historical bars to compare the current values.
- ‘0-line threshold‘ – the threshold for the ‘Strength’ buffer, which is used to determine the confirmation/momentum mood.
- ‘Momentum sentiment candles span‘ – the number of candles to detect the confirmation/momentum mood. If the ‘Strength’ buffer makes a certain percentage of positive/negative changes during this number of candles, it will be considered that the market has an impulse in this direction.
- ‘Momentum sentiment %‘ – the percentage of positive / negative changes in the ‘Strength’ buffer over the specified number of candlesticks from the previous parameter required to confirm the momentum in this direction.
- ‘Fractal size‘ – the size of the fractal in one direction. Used to determine the forecast/reversal sentiment.
- ‘ZigZag confirmation bars‘ – the number of closures required to comply with the ZigZag level to cope with redrawing. The principles of the ZigZag indicator are used to determine the forecast/reversal sentiment.
- ‘Depth‘ – the depth for the ZigZag indicator.
- ‘Deviation‘is the deviation of the ZigZag indicator.
- ‘Backstep‘ – the number of history bars for the ZigZag indicator.
- ‘Show once‘ – if true, the arrows should alternate. For example, after a confirming bullish arrow appears, a confirming bearish arrow must appear so that the next confirming bullish arrow can appear. If false, the indicator shows all the sentiment signals as they are detected.
- ‘Show predicting sentiment change‘ – if true, the forecast mood arrows are displayed on the chart.
- ‘Show continuation sentiment change‘ – if true, the continuation mood arrows are displayed on the chart.
- ‘Show confirming sentiment change‘ – if true, the confirmation mood arrows are displayed on the chart.
- ‘Alerts‘ – if true, when any of the arrows appear, the indicator will send on-screen alerts in the MetaTrader 4 terminal with the name of the symbol on which this event occurred.
- ‘Push notifications‘ – if true, when any of the arrows appear, the indicator will send push notifications to the mobile terminal with the name of the symbol on which this event occurred.
- ‘Emails‘ – if true, when any of the arrows appear, the indicator will send a message to the email with the name of the symbol on which this event occurred.
[/spoiler]