


A common sense approach to price observation
- Buy when prices rise and sell when prices fall
- Buy when prices rise and sell when prices fall
The above statement about buying when prices go up, or selling when prices go down, may be too general, and therefore it may require some guidelines and rules, that’s where The 3 Duck’s comes into play.
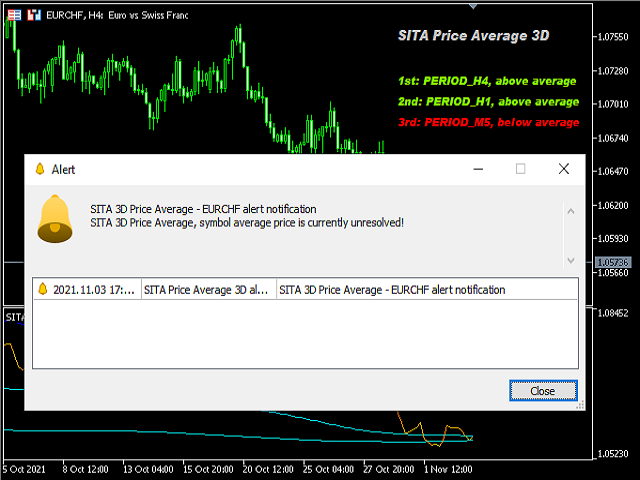
The SITA 3D Price Average indicator will help you determine buying opportunities in the direction of the last uptrend and selling opportunities in the direction of the last downtrend. The word “duck” in the title comes from the saying “line up all your ducks in a row”, which means “to have everything in the right order”. There are three ducks: the first duck will help you determine the latest uptrend or downtrend, the second duck will help confirm the direction of the trend, and the third duck will help you determine the possibility of buying or selling in the direction of the trend. This indicator uses three different timeframes: a 4-hour chart (the first duck), a 1-hour chart (the second duck) and a 5-minute chart (the third duck).
- The first thing we need to do is look at our largest timeframe (4 hours of the 1st duck) and see if the current prices are higher or lower. This duck tells us that the current price is higher or lower. This tells us that we may want to buy or sell.
- The second thing we need to do is look at our (1-hour 2nd duck), we also need to see the current price higher or lower on this chart, this gives us confirmation, for example, if these two ducks are below average now, we focus on selling, and if they are higher, we focus on buying. Important – If the current average price does not correspond to the 1st duck (4 hours), we cannot proceed to step 3.
- From steps 1 and 2, an example for buying – the current prices for the 1st, 2nd and 3rd duck should now be above average. Now on the 3rd duck (5 minutes) we are looking for additional confirmation by opening an additional 5-minute chart without this indicator, and we have to wait and let the price overcome the last maximum on the 5-minute chart to open a buy order.
[spoiler title=”Read More…”]
What about goals?
Stop the loss
Here you can make this system your own. If you are a short-term trader, you can place a stop loss below the lows on a 5-minute or 1-hour chart. If you are more of a positional trader, you can place a stop loss above the minimum on a 4-hour chart. You can also use a fixed stop loss, perhaps 25-30 pips or more from the entry. It all depends on what kind of trader you are, it’s up to you! If you are a long-term trader or investor, this system can help you get a good entry point into the market. Another “trick” that can help you save capital. If you do buy, and prices return below 5 min 60 sma by 10 points (not a very good sign), you can reduce your losses before the stop loss. But if you are a long-term trader, it may not matter much to you.
Lock in profits
Again, it depends on what kind of trader you are, but profit targets can be, for example, support or resistance levels or something else that suits your trading style.
Indicator Settings
Show indicator panel – Show/hide the signal panel
Apply warnings – allow the use of warnings
Pop-up window – pop-up messages
Notifications – Push notifications (requires you to configure your terminal to work with this).
Email – Email messages (requires you to set up your terminal to work with this)
Sound – sound playback
[/spoiler]