


The MT4 indicator for professionals.
The task of the indicator is to determine the future behavior of the price.
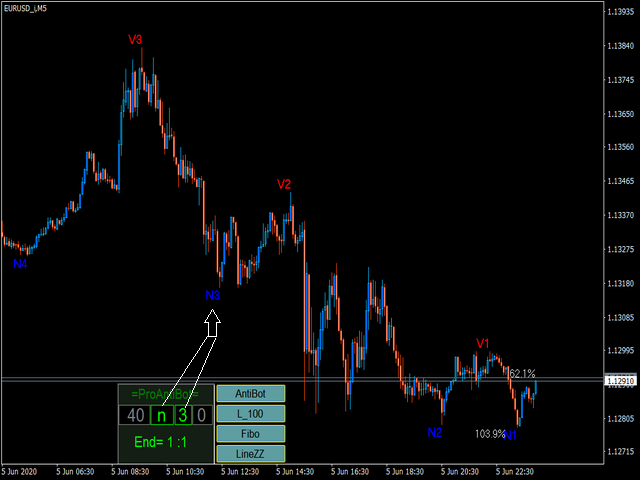
It defines and draws on the graph:
- tops and bottoms of waves in the selected price range
- the lines of the predicted channels on which the price is delayed
- zones of a probable horizontal channel( flat)
- Fibonacci levels
- levels on round price values
- unique lines along the tops of the waves.
- percentage of correction or momentum of the current and previous waves
- the time until the end of the current bar.
The principle of operation is based on the developed new wave theory and the behavior of robotic systems.
It is as simple and easy to manage as possible. The control panel is displayed on the screen. By clicking on the desired cell, the parameters are entered in the graph window.
- The first cell on the left is the value for calculating the wave structure. Any value from 3 to 250 is relevant .
- The second cell is used to select the tops of waves or the bottoms of waves. By default, the letter is calculated by the program. If you select the letter “v”, the indicator will scan from the upper levels (“bear”). If you select the letter “n”, the indicator will scan from the lower levels (“bull”).
- The third cell is used to select the number of the top or trough of the wave from 1 to 4.
- The fourth cell is a corrector for fine tuning. Selecting a value from 0 to 10.
[spoiler title=”Read More…”]
The second and third cells together form a unique name for the wave vertices, since they are marked on the graph.
All lines of the indicator are likely support or resistance for the price. The line density will depend on the parameter in the first cell.
It is able to determine in advance the places of a possible flat.
For informational purposes, make stops in the tester and check the levels of “bulls”or ” bears”. Just change the letter and digit of the unique name of the wave top and the indicator will analyze the behavior of the opposite group of market players.
Experiment with the settings and then you will see the indicator in all its glory.
The indicator is updated automatically on a new bar. The manual setting is valid only until the bar is updated.
It is better to adjust the indicator when a new bar appears on the chart. To apply the new parameter, click on the desired cell on the chart and enter the new value.
The indicator was made for myself, according to my wishes, experience and vision of the market.
I will be grateful if you leave your comment. Offer your options for improving the product.
[/spoiler]