


The indicator is designed to meet the needs of all traders who trade according to the market profile. It provides functionality and the ability to display the market profile for the required number of bars in the history.
Main features
- The ability to display the profile for the required number of bars in the history.
- Displaying the profile for the required period of time and managing it from the graph.
- Displaying the required number of horizontal lines.
- Displaying the profile from the convenient side.
- Graphical representation of the profile in the form of a gradient, according to the strength of the levels.
- Changing the color of the profile and the accumulation center.
- Point of control (Point of control).
- Since version 1.3, the indicator control panel has appeared.
Input parameters
- Amount of horizontal lines – the number of horizontal lines in the profile
- Min amount of bars in the range – the minimum amount between borders/lines
- Histogram position:
- Right inside-the profile is displayed between the borders/lines and is fixed on the right.
- Chart right-the profile is displayed from the right border on the chart
- Profile MODE:
- Strict – in this mode, it is not possible to move the right border, it is tied to the last bar. It is also not possible to transfer the profile to any date and control panels.
- Flexable-in this mode, you can move any profile border and set dates in the control panel.
- Left line style – the style of the left border/line
- Left line color – the color of the left border/line
- Right line style – the style of the right border/line
- Right line color – the color of the right border/line
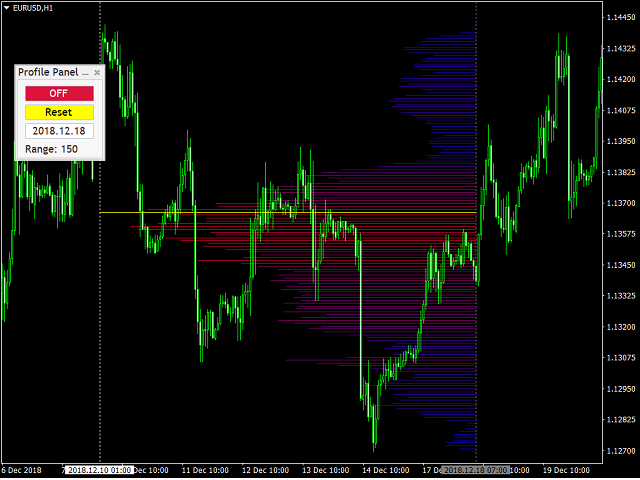
Control Panel
- ON/OFF-the button enables / disables the profile display on the chart
- Reset-resets the profile settings to the default settings.
- Date box-displays the number of the right border/line. You can specify the required date, then the right border / profile line will be moved to the specified date.
- Range-shows the number of bars between the lines/borders.
[spoiler title=”Read More…”]
The indicator is designed to meet the needs of all traders who trade according to the market profile. It provides functionality and the ability to display the market profile for the required number of bars in the history.
Main features
- The ability to display the profile for the required number of bars in the history.
- Displaying the profile for the required period of time and managing it from the graph.
- Displaying the required number of horizontal lines.
- Displaying the profile from the convenient side.
- Graphical representation of the profile in the form of a gradient, according to the strength of the levels.
- Changing the color of the profile and the accumulation center.
- Point of control (Point of control).
- Since version 1.3, the indicator control panel has appeared.
Input parameters
- Amount of horizontal lines – the number of horizontal lines in the profile
- Min amount of bars in the range – the minimum amount between borders/lines
- Histogram position:
- Right inside-the profile is displayed between the borders/lines and is fixed on the right.
- Chart right-the profile is displayed from the right border on the chart
- Profile MODE:
- Strict – in this mode, it is not possible to move the right border, it is tied to the last bar. It is also not possible to transfer the profile to any date and control panels.
- Flexable-in this mode, you can move any profile border and set dates in the control panel.
- Left line style – the style of the left border/line
- Left line color – the color of the left border/line
- Right line style – the style of the right border/line
- Right line color – the color of the right border/line
Control Panel
- ON/OFF-the button enables / disables the profile display on the chart
- Reset-resets the profile settings to the default settings.
- Date box-displays the number of the right border/line. You can specify the required date, then the right border / profile line will be moved to the specified date.
- Range-shows the number of bars between the lines/borders.
The indicator is designed to meet the needs of all traders who trade according to the market profile. It provides functionality and the ability to display the market profile for the required number of bars in the history.
- The ability to display the profile for the required number of bars in the history.
- Displaying the profile for the required period of time and managing it from the graph.
- Displaying the required number of horizontal lines.
- Displaying the profile from the convenient side.
- Graphical representation of the profile in the form of a gradient, according to the strength of the levels.
- Changing the color of the profile and the accumulation center.
- Point of control (Point of control).
- Since version 1.3, the indicator control panel has appeared.
- Amount of horizontal lines – the number of horizontal lines in the profile
- Min amount of bars in the range – the minimum amount between borders/lines
- Histogram position:
- Right inside-the profile is displayed between the borders/lines and is fixed on the right.
- Chart right-the profile is displayed from the right border on the chart
- Profile MODE:
- Strict – in this mode, it is not possible to move the right border, it is tied to the last bar. It is also not possible to transfer the profile to any date and control panels.
- Flexable-in this mode, you can move any profile border and set dates in the control panel.
- Left line style – the style of the left border/line
- Left line color – the color of the left border/line
- Right line style – the style of the right border/line
- Right line color – the color of the right border/line
- Right inside-the profile is displayed between the borders/lines and is fixed on the right.
- Chart right-the profile is displayed from the right border on the chart
- Strict – in this mode, it is not possible to move the right border, it is tied to the last bar. It is also not possible to transfer the profile to any date and control panels.
- Flexable-in this mode, you can move any profile border and set dates in the control panel.
- ON/OFF-the button enables / disables the profile display on the chart
- Reset-resets the profile settings to the default settings.
- Date box-displays the number of the right border/line. You can specify the required date, then the right border / profile line will be moved to the specified date.
- Range-shows the number of bars between the lines/borders.
[/spoiler]