


Trend Trading is an indicator designed to maximize profits from trends occurring in the market
by determining the time of rollback and breakout. It finds trading opportunities by analyzing what the price is doing during established
trends.
[ Manual
Installation Instructions / Manual
by Update | Elimination
problems | FAQ
| All
products ]
- Trade in financial markets with confidence and efficiency
- Profit from established trends without delay
- Recognize profitable pullbacks, breakouts, and early reversals
- The indicator analyzes its own quality and performance
- It implements a dashboard with multiple timeframes
- The indicator is not repainted
- It implements email/audio/visual alerts
Established trends offer dozens of trading opportunities, but most trend indicators completely neglect them.
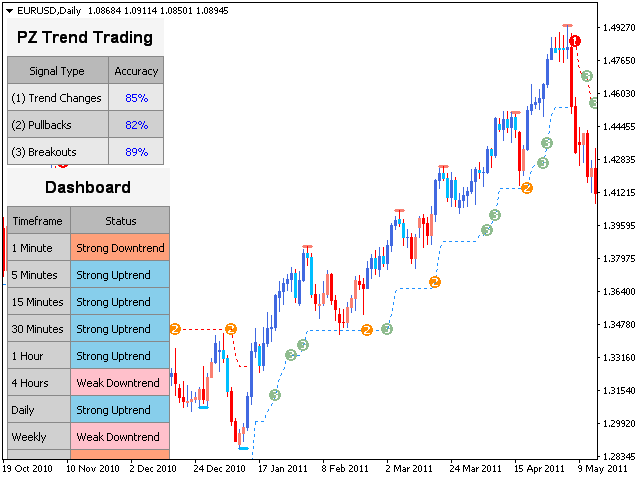
Interpreting the indicator is quite simple:
- (1) this is a trend change
- (2) pullback in the direction of the trend
- (3) breakout in the direction of the trend
- The red line is a correction during a downtrend
- The blue line is a correction during an uptrend
- Blue Bars – bullish sub-trend
- Red bullion is a bearish sub-trend
Input parameters
- Indicator Period: This parameter controls sensitivity to trend changes. A longer period will lead to longer
trends. A short period will lead to catching shorter trends, but faster recognition of changes.
trends. - Display sub-trend: Enable this option to see the sub-trend reflected in the color of the price bars.
- Display rollbacks: Enable this option to see the rollbacks displayed as (2) objects on the graph.
- Display Breakouts: Enable this option to see breakouts in the trend direction displayed as (3) objects.
- Adjust the display: Enable this option to see trend corrections displayed as colored strokes.
- Maximum. History Bars: This parameter controls the number of past bars when loading the indicator.
- Display Dashboard: Enable this option to see a dashboard with multiple timeframes on the chart.
- Display statistics: Enable this option to display the statistics panel on the chart.
- Drawing parameters: Select the color and width of the correction lines displayed on the graph.
- Alerts: Enable display/email/push/sound alerts for all trading settings enabled above.
Support and questions
Use the help desk for questions or timely support. Write a letter to:
[email protected]
author
Arturo Lopez Perez, private investor and speculator, software engineer and founder of Point Zero Trading Solutions.
[spoiler title=”Read More…”]
Trend Trading is an indicator designed to maximize profits from trends occurring in the market
by determining the time of rollback and breakout. It finds trading opportunities by analyzing what the price is doing during established
trends.
[ Manual
Installation Instructions / Manual
by Update | Elimination
problems | FAQ
| All
products ]
- Trade in financial markets with confidence and efficiency
- Profit from established trends without delay
- Recognize profitable pullbacks, breakouts, and early reversals
- The indicator analyzes its own quality and performance
- It implements a dashboard with multiple timeframes
- The indicator is not repainted
- It implements email/audio/visual alerts
Established trends offer dozens of trading opportunities, but most trend indicators completely neglect them.
Interpreting the indicator is quite simple:
- (1) this is a trend change
- (2) pullback in the direction of the trend
- (3) breakout in the direction of the trend
- The red line is a correction during a downtrend
- The blue line is a correction during an uptrend
- Blue Bars – bullish sub-trend
- Red bullion is a bearish sub-trend
Input parameters
- Indicator Period: This parameter controls sensitivity to trend changes. A longer period will lead to longer
trends. A short period will lead to catching shorter trends, but faster recognition of changes.
trends. - Display sub-trend: Enable this option to see the sub-trend reflected in the color of the price bars.
- Display rollbacks: Enable this option to see the rollbacks displayed as (2) objects on the graph.
- Display Breakouts: Enable this option to see breakouts in the trend direction displayed as (3) objects.
- Adjust the display: Enable this option to see trend corrections displayed as colored strokes.
- Maximum. History Bars: This parameter controls the number of past bars when loading the indicator.
- Display Dashboard: Enable this option to see a dashboard with multiple timeframes on the chart.
- Display statistics: Enable this option to display the statistics panel on the chart.
- Drawing parameters: Select the color and width of the correction lines displayed on the graph.
- Alerts: Enable display/email/push/sound alerts for all trading settings enabled above.
Support and questions
Use the help desk for questions or timely support. Write a letter to:
[email protected]
Arturo Lopez Perez, private investor and speculator, software engineer and founder of Point Zero Trading Solutions.
[/spoiler]