


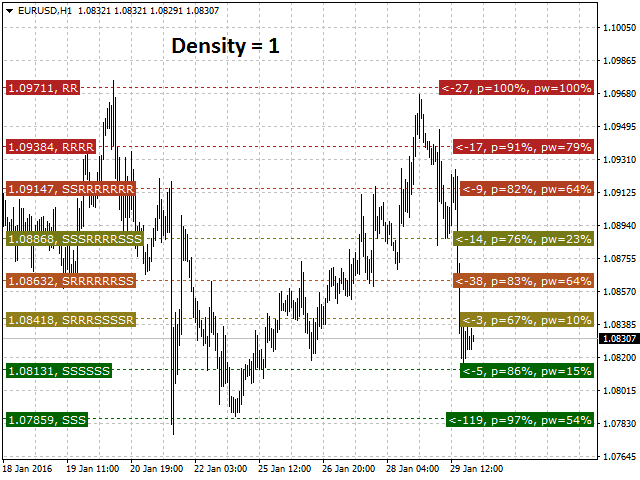

The indicator plots horizontal support and resistance levels,
using the grouping of extremes. Levels are displayed as lines,
the color of which depends on how many times the level is on the specified section
he was a support and a resistance. You can also customize the display
support, resistance, and level age counters in text form.
The age of the level shows how many bars ago the last impact was
level on the price (on the chart with the period specified in the settings). Taking into account
the age of the level, you can draw conclusions about the possibility of its influence on the price at
the moment.
When displaying values, the following abbreviations are used:
The input parameters are described below.
- if true, the indicator will be recalculated, snapping to the right-most bar on the screen;
- if the value is false, the indicator will always be linked to the bar with the index 0.