


Last copies at 30$
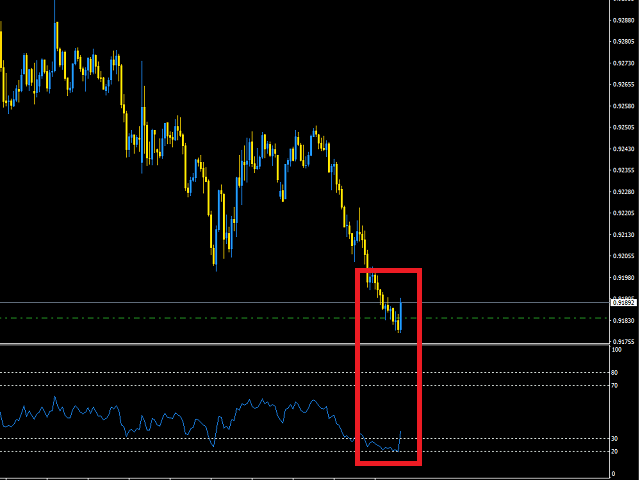
This indicador offer you the possibility to see in one screen if any asset is over bought or over sold.
Also you can configurate different type of alerts (push, sms or normal alerts)
– Up to 6 timeframes
– Different rsi periods for different timeframes (normally 14 or 21 periods)
– Different rsi modes for different timeframes (recommended Close Price)
– Dashboard colors
– Soft and hard over sold and over bought levels with different colors
Use a multi-timeframe entry method. Wait for multiple time frames to become overbought or oversold (e.g. M15, M30, H1, H4) then enter when a lower timeframe also becomes extended. The more timeframes you have in the same colour the more over-extended it is in one direction and the more likely it is to pullback or reverse.
Other strategy is compare rsi levels in correlated assets to know temporal uncorrelations and exploit it