


It is an insightful and accurate indicator of support and resistance levels. It moves them correctly in time and works perfectly on all timeframes and most trading instruments.
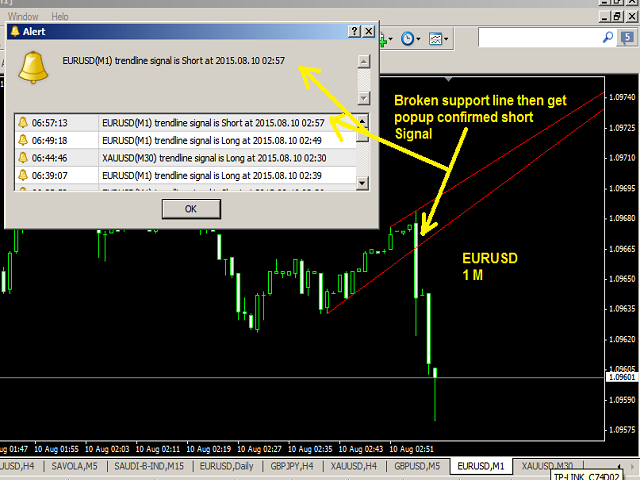
It uses the real upper and lower points of each of the last 20 candles. If the price crosses the red trend line from the bottom up and confirms the closing of the candle above the line, the indicator will give a buy signal, which will inform that the current resistance line has been broken and prices can continue to go up. Also, if a candle from below breaks through one of the lines (especially if it is the lower line) with a confirmed candle, the indicator will give a buy signal, which will inform that the current support line has been broken and prices may continue to go down.
The advantage of this indicator is that it gives a signal long before significant price movements, which gives you time to buy or sell. I have added notification settings via emails and messages, so that you can install the indicator on your MT4 platform on a VPS and receive immediate trading signals to your mobile terminal, and make trading decisions without being distracted from leisure or daily activities. You just need to specify the Metaquote ID in the settings window of your MT4 terminal.
[spoiler title=”Read More…”]
Note: The signal appears immediately after the formation of a closed candle above or below the red trend line.
You can set the indicator on all timeframes to see the real movement of support and resistance levels that you can rely on, especially on 4-hour, daily, weekly and monthly charts. Of course, you can install the indicator on most charts at the same time to get the most relevant intraday trading signals. 1-15-minute charts are well suited for scalping, and 30-minute – 4-hour charts will suit intraday traders. Charts from 4 hours to a month are suitable for long-term traders (period from 1 to 30 days).
The only input parameter of the indicator is PopupAlert=true, which opens a window showing a buy or sell signal when a breakout of the current support or resistance is confirmed. If you set the value to false, the window will not be displayed.
Based on my experience with long trades using this indicator, such a trade is closed when you receive the opposite short signal, which can lead to a reversal of the trade, and vice versa. But I recommend taking the profit when it seems acceptable to you. In the general settings, you can click on “Allow DLL import” and allow the import of external experts.
Important note: for traders using the indicator to trade signals. You need to set the stop loss to the level before the breakout in order to avoid a false breakout of the support and resistance levels. To confirm the signal, you can add other indicators, for example, CCI or RSI. They will be added in the next version of the Expert Advisor. (See attached screenshots).
I will follow the comments and try to give exhaustive answers to your questions as soon as possible.
Thanks.
Sami Saydam
The indicator is copyrighted from 2010 UKC (316009) and belongs to Sami Saidam. Any copying and use of the indicator methods separately or as part of any expert without the author’s permission is prohibited.
[/spoiler]