


The indicator identifies and marks on the chart the short-term lows and highs of the market in accordance with the definition given by Larry Williams in the book “Long-term secrets of short-term trading”.
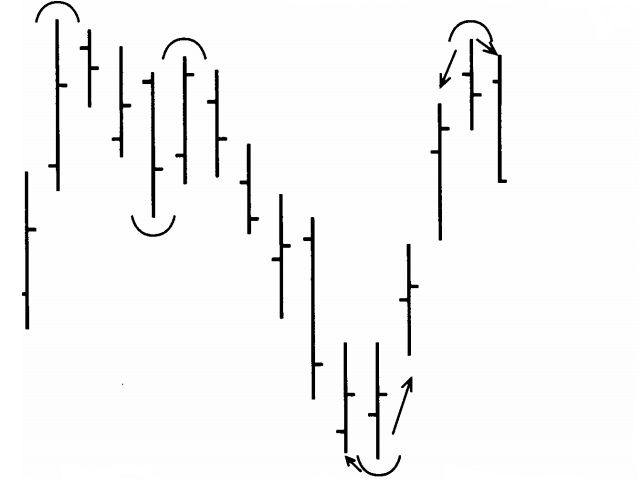
“Every time there is a daily low with higher lows on either side of it, that low is short-term. We know this because a study of market behavior shows that prices fell to a low on the day, then failed to go lower and turned up, marking this final low as the short-term lowest value. The greatest maximum of the short-term market is the same, only the opposite. Here we will observe a high with lower highs on either side of it. This suggests that prices rose to the top in the middle of the day, then began to move down, and in the process of movement, a short-term high was formed. For our purposes, when identifying short-term swing points, we simply ignore the “internal” days and the possible short-term pivot points they produce.”
“Every time there is a daily low with higher lows on either side of it, that low is short-term. We know this because a study of market behavior shows that prices fell to a low on the day, then failed to go lower and turned up, marking this final low as the short-term lowest value. The greatest maximum of the short-term market is the same, only the opposite. Here we will observe a high with lower highs on either side of it. This suggests that prices rose to the top in the middle of the day, then began to move down, and in the process of movement, a short-term high was formed. For our purposes, when identifying short-term swing points, we simply ignore the “internal” days and the possible short-term pivot points they produce.”
[spoiler title=”Read More…”]
If a short-term high is formed, the indicator starts displaying a red “down” arrow above the level of the central bar that forms the pivot point. A green up arrow appears under the up pivot point. The signal is considered formed after the closing of the last bar on the chart.
Larry Williams recommends buying or selling an asset at the opening price of the next bar after the formation of a trading signal, setting a stop loss above (below) the local maximum (minimum).
Swing points trading signals serve as good filters and amplifiers for other trading strategies.
- Draw incomplete signals-true-it is allowed to draw arrows on the chart about preliminary trading signals on an unclosed period. false-preliminary trading signals are not allowed for an open period.
- MA period – the period of the moving average relative to which the trading signals of local extremes are formed
- MA Method-select the type of moving average
[/spoiler]