


The SPR of trend indicator is looking for a trend:
- (S) – signals,
- (P) – shows the potential of the signals,
- (R) – calculates the risk/reward.
Analyzing the chart, the indicator indicates a possible price movement option. The indicator works on closed candles and does not redraw!
The indicator has a block of statistics on its own signals.
As a material for statistics, the indicator uses the maximum price movement after the signal appears on a closed candle from the opening price of the current candle and up to:
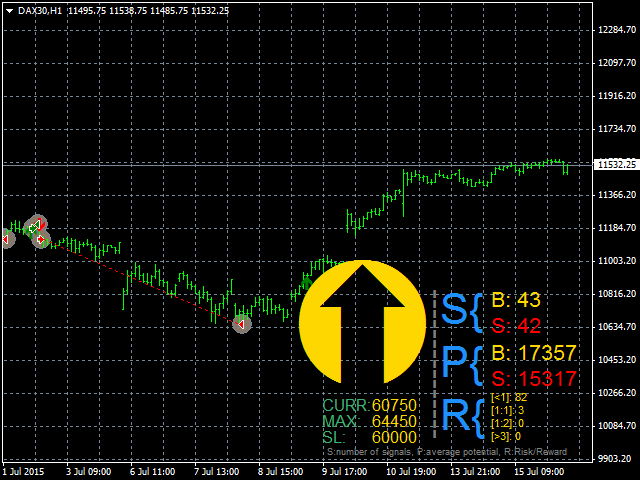
The screenshot shows that this statistics block is located in the lower right corner.
- S is the number of signals found for buying and selling.
- P is the potential of movement after the signal. It is calculated as the average value of the maximum price movement of all signals for buying and selling, respectively.
- R is the risk / profit ratio. To get this parameter, the indicator uses a virtual StopLoss.
- curr – the current virtual profit after the last signal of the indicator.
- max – the maximum price movement after the signal and up to the current moment.
- SL – the value of the virtual StopLoss at the current moment.
Attention! All signals and calculation results are based on statistical data and cannot be used as a direct guide for investing.