


The SpreadInfo indicator displays the movement of a synthetic instrument, which consists of several basic instruments.
The concept is very simple. A synthetic tool is being compiled, which is described by a simple formula (the parameter of the spread indicator).
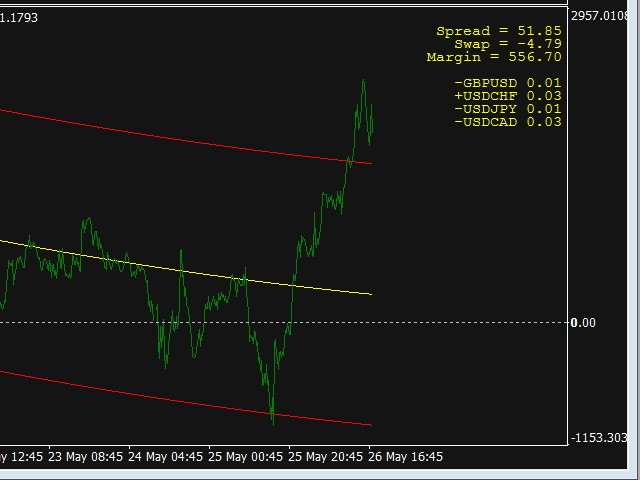
The indicator plots a graph of this synthetic instrument and builds a regression channel based on this graph (see screenshots).
- Make sure that all currency pairs specified in the indicator formula are present in the “Market Overview” window.
- Make sure that the quotes of all pairs of the selected timeframe are loaded.
- Drag the SpreadInfo indicator from the navigator to the chart and adjust the input parameters at your discretion.
- The indicator is resource-intensive, so the barsCalculate parameter has been added. It is recommended to set its value to no more than 4000.
- Trading style – depending on your strategy, it can be used for a breakdown of the regression channel or for a rebound.
- spread – the actual “formula” describing the synthetic itself takes values in the form of a formula ([-EURUSD{0.02}][-GBPUSD{0.09}][ NZDUSD{1.02}]..[ AUDUSD{0.03}]), where ( |-) is the (BUY|SELL) symbol {lot}
- postfix – for characters that have a “tail”, for example EURUSD.m, you must specify in this parameter.m
- cDegree – curvature of the regression channel
- cWidth – width of the regression channel
- rcDaysBack – how many days to build a regression channel
- cSmooth – smoothing of synthetic graphics
- showComment – show comments on the chart, such as Spread, Required Collateral, Swap
- startFrom – date/time of the start of the synthetic countdown
- barsCalculate – the number of bars to calculate.