


The Stochastic Divergence indicator is a modern indicator that uses algorithms developed by BJF Trading Group. Divergences are displayed on the price and indicator charts. The indicator arrows
appear when a new bar appears, the indicator is not
redrawn, and you can trade using these signals. Moreover,
the indicator is never late! The analysis is carried out on the completed
bars, the arrows of the trading signals (shown above/below the prices) never
disappear.
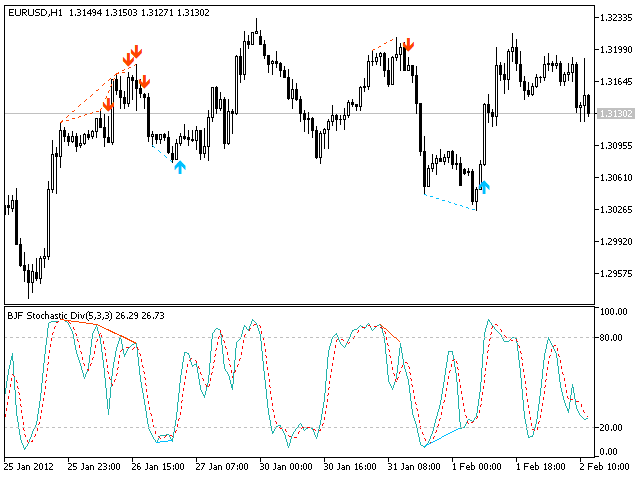
The Stochastic Divergence indicator shows the divergence in fractals relative to the Stochastic indicator. The occurrence of a divergence between the price and the Stochastic indicator means an early change in the current trend. A buy signal occurs when a new down fractal (Low-fractal) is lower than the previous one, and the Stochastic indicator values are higher than the previous one. A sell signal is formed when a new Up-fractal occurs above the previous one, and the Stochastic value is lower than the previous one. The indicator has many settings.
Hidden bullish divergence occurs when the price forms a new high and the oscillator shows a new low. This can be seen in cases of upward movement. As soon as the price makes a higher high, you need to check whether the same thing happened with the oscillator. If this did not happen, but the oscillator formed a new low, then a bullish divergence occurred.
[spoiler title=”Read More…”]
Hidden bearish divergence occurs when the price forms a new low, but the oscillator shows a new high. This happens in a downtrend. When you see a hidden bearish divergence, there is a high probability that the pair will continue to move down and the downtrend will continue.
[/spoiler]