


Indicator Strong Trend Flat Signal (STFS) represents the intersection of
two
non-lagging moving averages developed by the author with averaging periods of 21 and 63.
A simple moving average (SMA) with an averaging period of (2n 1)
bars is always n
bars behind. Such a strong lag, if the SMA or other types of moving averages
serve as the basis for making trading decisions, does not allow
you to open and close positions in a timely manner, which leads to losses.
Neotstayuschy moving average
calculated at points (Inf, n 1] in the usual way, and the points of the segment [n, 0], where 0 is the number of the last bar, and is algorithmically
there is a curvilinear sector
(sumatibai confidence interval) in which the moving average line neotstayuschy
stacked with specified in the indicator settings confidence probability. It is clear that the higher the confidence value is taken
(which is 0.67 by default), the wider the curved
sector of the confidence interval is obtained. If the confidence probability is taken
to be zero, then the sector of the indicator readings at points [n, 0] will
shrink to a curve, which will pass
along the most likely values of the non-
lagging average there. Statistical studies show
that the price around the non
-lagging average is distributed according to Laplace’s law, knowledge of which, together with the algorithm for calculating the most likely non-
lagging average on the segment [n,
0], actually
allows us to calculate the sector of the confidence interval.
[spoiler title=”Read More…”]
If the lower border of the curly
sector of the slow component of the STFS indicator moves to the top, then there is an
uptrend and you need to open positions on Buy.
If the upper border of the
curved sector of the slow component of the STFS indicator is oriented down, then there is a
downtrend and you need to open positions on Sell. In such cases, you can be
sure that the trend direction you set is correct with the confidence probability set in the
settings.
If the upper bound of the curly
sector is the slow component of the indicator
STFS moves to the top, and the lower border-down, then there is a
flat, which serves as a signal for
closing trend positions.
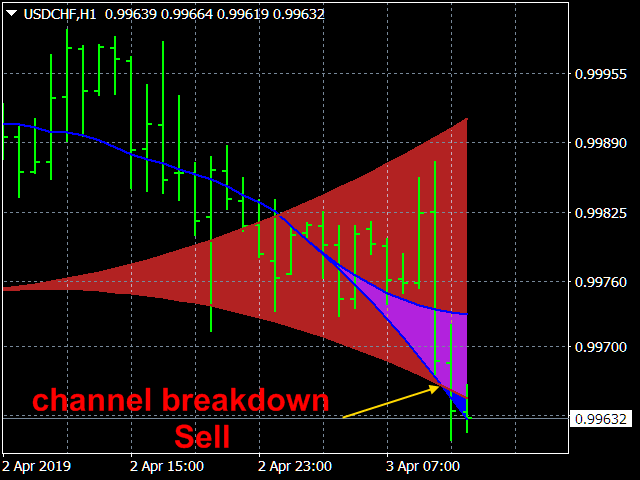
If the
slow component of the indicator determines a flat or a channel, but the sector of the fast
component noticeably goes beyond the boundaries of the sector of the slow component, then this
means a breakdown of the channel and serves as a signal for opening the corresponding
position.
If the
slow component of the indicator determines the trend, but the sector of the fast
component significantly exceeds the boundaries of the sector of the slow component from the side opposite
to the trend direction, this means the end of the trend
and serves as a signal to close the corresponding position.
- Price type – The price type. Values: Close price,
Open price, High price, Low price, Median price ((high low)/2-default), Typical price ((high
low close)/3),
Weighted price ((high low 2*close)/4). - The averaging method – The averaging method. Values:
Simple (default),
Exponential, Smoothed, Linear
weighted. - The
first averaging period – The period of averaging the first
lines. Values: any integer (21 by
by default). - The
second averaging period – The period of averaging the second line. Values: any integer (63 by
by default). - Confidence probability –
Confidence probability. Values: from 0 to 0.999 (0.67 by default
by default). - Global shift – Global shift of the start of the reading
the indicator in the bars. Values: any positive integer (0 by default). - Color
of the first line. – Color
the first line of the indicator and its curly sector. - Color
of the second line. – The color of the second line of the indicator and its curly
sectors. - Paint over the confidence interval?
– Fill in the sectors of the confidence level
the interval? Values: true (default), false.
[/spoiler]