


This is a cluster indicator, which is a development of the CCFpExtraSuperMulti line . Now it is more adapted to work with mixed clusters, which can include symbols from different markets. For example, you can simultaneously view Forex currencies and stock indexes, CFDs, and commodities. The number of displayed lines has been increased to 16. Now you can enable an interactive ruler to measure the difference between lines.
As in CCFpExtraSuperMulti, the indicator creates a set of built-in cluster indicators (CCFpExtraIndices) with carefully selected periods and combines their results using special balancing and normalization algorithms. Up to 15 instruments can participate in the calculation.
This is a cluster indicator, which is a development of the CCFpExtraSuperMulti line . Now it is more adapted to work with mixed clusters, which can include symbols from different markets. For example, you can simultaneously view Forex currencies and stock indexes, CFDs, and commodities. The number of displayed lines has been increased to 16. Now you can enable an interactive ruler to measure the difference between lines.
[spoiler title=”Read More…”]
As in CCFpExtraSuperMulti, the indicator creates a set of built-in cluster indicators (CCFpExtraIndices) with carefully selected periods and combines their results using special balancing and normalization algorithms. Up to 15 instruments can participate in the calculation.
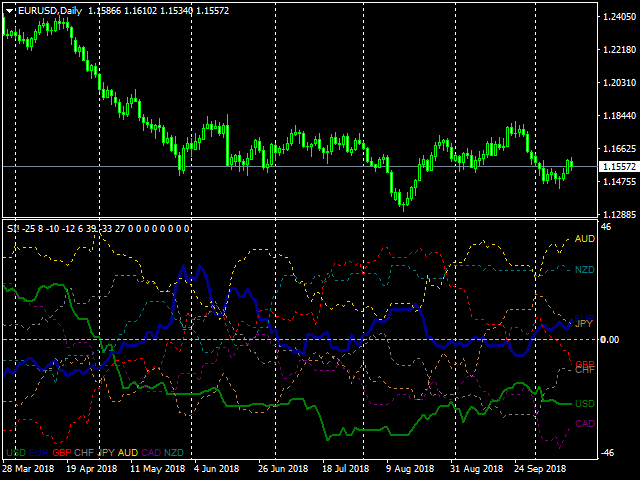
The higher the ticker or currency, the stronger the buy signal, and the lower – the stronger the sell signal. The most reliable trading plan: buy the tops and sell the bottoms.
The ticker and/or currency lines corresponding to the chart’s working tool are displayed in bold. For example, on the DAX30 chart, the fattest line will be DAX30, and the less fat line will be EUR, as the DAX30 quote currency. Other indices, CFDs, and commodities with the same quote currency are displayed in thin solid lines (in this case, such as STOXX50, CAC40). Other indices, CFDs, and commodities (with different quoted currencies) are displayed as broken lines. Other currencies are shown as dotted lines.
At the right end of each line, a label with the name of the ticker or currency is displayed, as well as the signal value in the format -N( -D), where N is the difference between the ticker and the quote currency, and D is the average change in the signal over the last time (a day or 12 bars, whichever is greater). The larger the plus value of the signal, the brighter the blue color of the label is displayed. The more in the negative – the more bright red. Preference should be given to situations where both the signal and the dynamics of change are in the same direction. The value of a reliable signal is more than half of the scale.
If you click the mouse sequentially on the two placemarks to the right of the lines, a ruler (vertical line) will appear, tracking the signal strength between the lines as you move the mouse cursor through the history. To remove the ruler, click the two labels again.
Parameters:
- Instruments – comma – separated list of instruments, maximum – 15; instruments may not have a common currency-the indicator will try to find a way to convert through the default currency (DefaultBase, see below), analyzing the base currency (if there is one, as in Forex) and the quoting currency; the list of instruments by default includes the main Forex currencies EURUSD, GBPUSD,USDCHF,USDJPY,AUDUSD,USDCAD,NZDUSD; note that NZDUSD is not available on some servers MetaQuotes is a Demo,so don’t forget to edit the list accordingly;
- MA_Method-moving average method, by default linear weighted;
- Price – the type of moving average price, by default weighted price;
- All_Bars – the number of bars to calculate, by default-1000; 0 means all bars;
- BarByBar – the value false sets the recalculation of the zero bar on each tick, true (by default) – the calculation only at the beginning and at the end of the bar;
- DefaultBase – a common currency; it is used only if autodetection does not work;
- Prefix, Suffix – optional prefix and suffix in the name of the instruments (if they are used by the broker); by default – empty;
- Indicator_Prefix-common prefix for indicator objects, by default “S2_”; must be different for different indicator instances on the same chart.
[/spoiler]