


the Alert signal sends a push notification.
crosses your lines.
lines.
You can configure:
You can configure:
resistances and supports.
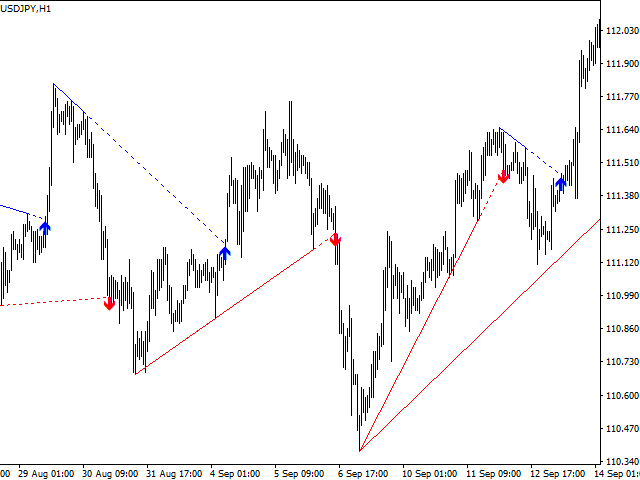
For example, if you want the indicator to find lines formed by 3 points on one straight line, then there will be many such signals, but not all of them.
they will be worth your attention. Or you can use a more rigorous search for lines consisting of 4 or 5 points on a single straight line, then
there will be fewer such signals, but they will be much more reliable.
[spoiler title=”Read More…”]
For example, if you want the indicator to find lines formed by 3 points on one straight line, then there will be many such signals, but not all of them.
they will be worth your attention. Or you can use a more rigorous search for lines consisting of 4 or 5 points on a single straight line, then
there will be fewer such signals, but they will be much more reliable.
2) Fractality. The fractality of the extremes (maxima and minima) is a parameter that determines how many candlesticks are left and right.
the right should be below the maximum, and how many candles on the left and right should be above the minimum.
In other words, it is also the minimum distance between the extremes that form the resistance and support lines.
3) Deviation from Line. This is the allowed number of points of indentation of one of the points from the line.
As with any indicator, all signals should be considered as a recommendation, and the decision on the transaction should be made independently.
If you properly configure the indicator and understand what trends and trend reversals look like, this indicator will qualitatively improve
the search for price reversal points, and most importantly, will save you several hours of time every day by searching for trends for you,
drawing lines, constantly monitoring and informing you in time about the breakout point of the trend line.
For testing, it is better to use the “all ticks” method, so you will see the full operation of the indicator with all the arrows, because
when testing by the method of “opening prices”, the arrows are not drawn in all cases (this is due to the peculiarity of the method of determining
the intersection of the line with the price).
I recommend using trend lines that are confirmed by 4 extreme candles or more (Points on Line). A deviation from the straight line (Deviation
from Line) is proportional to the spread on the traded instrument (and remember that 5 points in a four-digit quote = 50 points in a five-digit quote
quote). When setting up, follow the principle: it is better to have a few high-quality signals than a lot of low-quality ones.
I wrote this indicator to save many hours of daily work on viewing and plotting charts. And I have
a lot of time has been freed up, now I approach the laptop only when I hear a signal-I look and make a decision to enter into a transaction or
no. Good trading to all!
[/spoiler]