


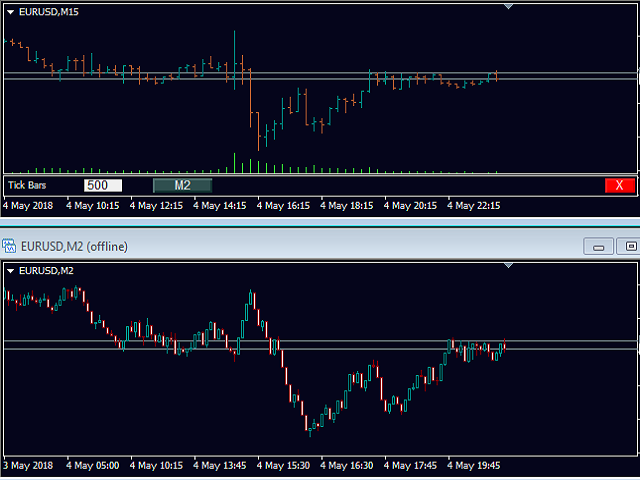

The indicator generates a chart from bars of a fixed tick volume in a given range from 1 tick, received in real time, the history is generated from the data of the chart to which the indicator is attached.
- Ticks-candle volume
- TickChart Timeframe – the period of the output chart, it can be any period that does not coincide with the standard periods
Just drag the indicator to the original chart, enter the desired bar volume and click the button, the chart will be opened in a new window with the specified period.
You can apply any indicators, scripts and Expert Advisors to the chart.