


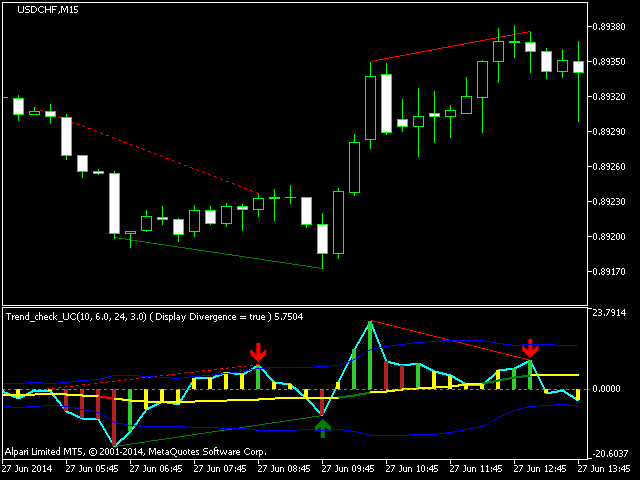

It gives a complete picture of the market situation: the strength and direction of the trend, the volatility, the price movement channel. Two graphical components:
- Buy: the signal line crossed the lower border of the channel, the histogram showed the beginning of an upward movement. The center line of the channel is either yellow (the channel is oriented horizontally) or green (the channel is directed upwards). When the middle of the channel is reached, it is recommended to move the position to breakeven. Closing a position after the formation of conditions for the sale.
- Sale: the signal line crossed the upper border of the channel, the histogram showed the beginning of a downward movement. The center line of the channel is either yellow (the channel is oriented horizontally) or red (the channel is directed downwards). When the middle of the channel is reached, it is recommended to move the position to breakeven. Closing a position after the conditions for the purchase are formed.
You can use divergence signals to enter a trade. If the divergence signal is received after the signal line crosses the channel boundary, then it is possible to enter in the direction of the opposite channel boundary without waiting for the histogram to confirm. It is not recommended to enter a trade with low market volatility – a narrow channel. It is not recommended to enter sales if the trend channel is directed up (green center line). It is not recommended to enter into purchases if the trend channel is directed down (the red central line).
[spoiler title=”Read More…”]
The histogram is a graph of the change in the slope of the regression line. Channel – the standard deviation from the average value of the slope of the regression line.
- Period histogram – the period for calculating the histogram, by default 24;
- Threshold histogram – threshold value for displaying a trend-free histogram, default 6.0 (range from -6.0 to 6.0);
- Period volatility band – the period for calculating the volatility channel, by default 24;
- Threshold volatility band-threshold value for displaying the horizontal orientation of the trend channel, default 3.0 (range from -3.0 to 3.0);
- Display cross bands volatility alert-alert when a signal line crosses the channel boundaries, by default true;
- Display divergence arrow-graphical display of divergence (arrows), by default true;
- Display divergence alert-divergence alert, true by default;
- Draw indicator trend lines-displays the trend lines of the indicator in case of divergence, by default true;
- Draw price trend lines-displays trend lines on the price chart in case of divergence, by default true;
- Line bull divergence color-selects the color of the trend line for bullish divergence, Green by default;
- Line bear divergence color-selects the color of the bear divergence trend line, Red by default;
- Arrows placement-placement of signal arrows.
The currency pair is USDCHF. Timeframe – any time frame. To trade on any currency pairs, use the Trend check indicator.
[/spoiler]