


Trend semaphore indicator TSI
- A working tool for displaying the force of movement.
- This tool was developed for trend-tracking strategies.
- It is recommended for any style of trading.
- It can be used on any instrument and market.
- It works on any timeframe.
- The designation of the trend with the help of multi-colored candles.
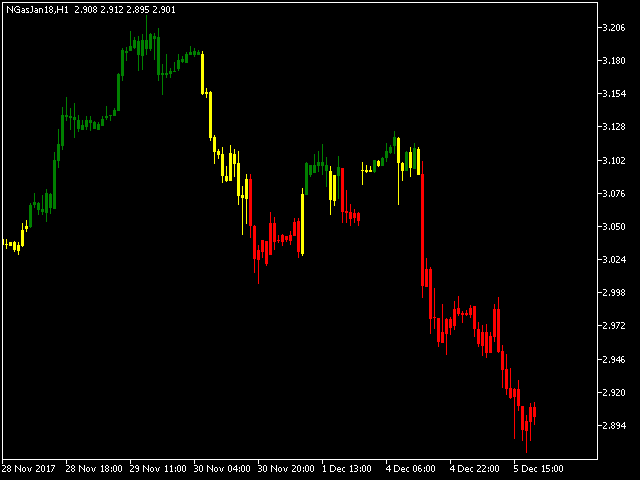
A signal about a new trend is given by changing the color of the candles on the chart.
The indicator shows uptrends in green, and downtrends in red. Weak movements, such as accumulation/consolidation, are highlighted in yellow.
The indicator does not redraw its signals.
Indicates the presence of a force in the direction of the signaled trend.
It is indicated by the color of the candles. Red indicates the aggressiveness of the downtrend, and green indicates the aggressiveness of the uptrend.
It shows that there is a decrease in strength in the direction of the signaled trend with aggression.
It is indicated by changing the color of the candles. The yellow color indicates a decline in the strength of a downtrend or an uptrend.
The loss of strength is determined only after the aggressiveness of the trend has been confirmed, changing the color from green or red to yellow.
[spoiler title=”Read More…”]
The method of trading on the indicator is a personal decision, each trader has his own method of applying it.
The most important thing is to take into account the colors. It is important to protect trades when the yellow color appears, setting the stop loss at the desired level in accordance with your risk level.
Description of functions A, B, C and D.
When enabled, each of these functions analyzes the price. If there is a strengthening or weakening of the trend, depending on the functions used, the indicator will color the candlesticks.
The set of rules for each function is based on strength and trend indicators.
- settings – Settings of Trend Semaphore Indicator: settings of the Trend Semaphore Indicator
- period_candles: the period of candles, by default – the current one
- info_options = Enable or disable to build the strategy-enable or disable the following functions to build a strategy.
- Use Option_A = true – use function A
- Use Option_B = true – use function B
- Use Option_C = true – use the C function
- Use Option_D = true – use the D function
If you want to use different combinations of functions A, B, C or D, simply enable or disable the corresponding parameters.
It is important to understand that there is a cyclical trend on highly liquid assets.
It is recommended to use the indicator on liquid instruments with moderate or high volatility.
The color of the candles is not based on the direction of the candle itself.
The indicator shows in color the direction and strength of the trend of the traded instrument, based on the calculations of the indicators included in it.
A long candle can be highlighted in yellow or red.
This may be due to the fact that a short candle is highlighted in yellow or green.
Please note: in some cases, the indicator may show signals that do not correspond to market conditions.
[/spoiler]