


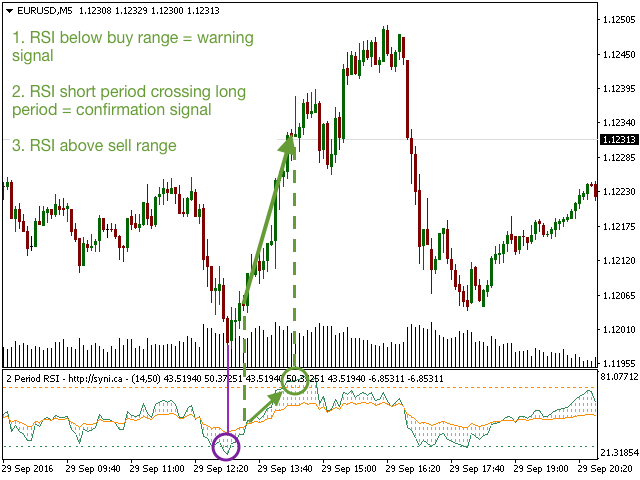

Two Period RSI compares long-term and short-term RSI lines and colors the area between them for better visualization. The color depends on the trend – ascending (short-term RSI above long-term) or descending (short-term RSI below long-term). The intersection of the RSI lines is a strong confirmation signal.
This is a small tool for visualizing and confirming RSI trends. We hope it will be useful to you!
Looking for RSI alerts? Download our Two Period RSI Alerts indicator, which includes custom alerts (audio, in the form of pop-up messages and emails).
Looking for RSI alerts? Download our Two Period RSI Alerts indicator, which includes custom alerts (audio, in the form of pop-up messages and emails).
- Short period (Default=14): the number of bars to calculate the short-term RSI
- Long period (Default=50): the number of bars to calculate the long-term RSI