


The Williams Dashboard helps you get a global market assessment based on the Williams Percentage Range values.
The Williams Dashboard analyzes and tracks all the tools you have selected. This is a very useful panel that allows you to open any chart in a few seconds and make a deal.
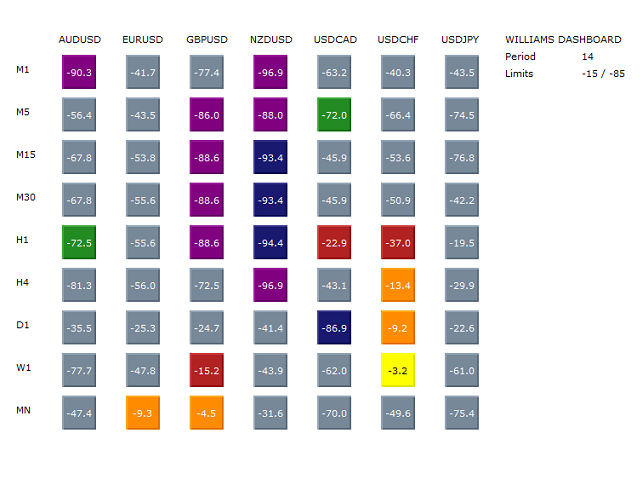
- A graphical panel that allows you to assess the situation on a variety of tools.
- 7 different situations in the Williams Percentage Range, which allow you to determine the oversold and overbought financial instrument.
- Alerts, letters and notifications let you know about new opportunities on the market.
- The Williams Percentage Range indicator is flexibly configurable.
- It is also possible to adjust the calculation of values after the candle closes or on the current candle.
Colors and notifications are configured in the Colors and Alerts section.
Alerts notify about the situation once on one candle. When overbought and oversold signals are triggered, notifications will be sent while the indicator is in this zone. Only one tool works in the demo version – this is due to the limitation of the strategy tester.
- Basic settings of Williams %R
- Period – period;
- Close Candle – Williams %R calculation on a closed candle or on the current one;
- Williams % R Levels = indicator Levels
- Up Level – upper level
- Down Level – lower level
- Symbols and TimeFrames – symbols and timeframes
- Symbols – a list of symbols to display, separated by “;” without spaces
- TimeFrames – a list of timeframes to display, separated by “;” without spaces – M1, M5, M15, M30, H1, H4, D1, W1, MN )
- Notifications
- Buy/Sell Alert, Mail or Notification – enable or disable notifications
- Overbought/Sold Alert, Mail or Notification – notifications about the overbought/oversold zone
- Cross Overbought/Sold Alert, Mail or Notification – notifications about the crossing of the overbought/oversold level
- Graphs – graph
- Font Color – font color
- Display Indicator Data – show or hide information about the Williams Percentage Range indicator and its settings
[spoiler title=”Read More…”]
- Period – period;
- Close Candle – Williams %R calculation on a closed candle or on the current one;
- Up Level – upper level
- Down Level – lower level
- Symbols – a list of symbols to display, separated by “;” without spaces
- TimeFrames – a list of timeframes to display, separated by “;” without spaces – M1, M5, M15, M30, H1, H4, D1, W1, MN )
- Buy/Sell Alert, Mail or Notification – enable or disable notifications
- Overbought/Sold Alert, Mail or Notification – notifications about the overbought/oversold zone
- Cross Overbought/Sold Alert, Mail or Notification – notifications about the crossing of the overbought/oversold level
- Font Color – font color
- Display Indicator Data – show or hide information about the Williams Percentage Range indicator and its settings
[/spoiler]