


Stop searching and trying out new indicators! Get the Winshots Massive FX Profits indicator and stand out from the crowd.
Years of trading experience have led us to create this universal indicator!
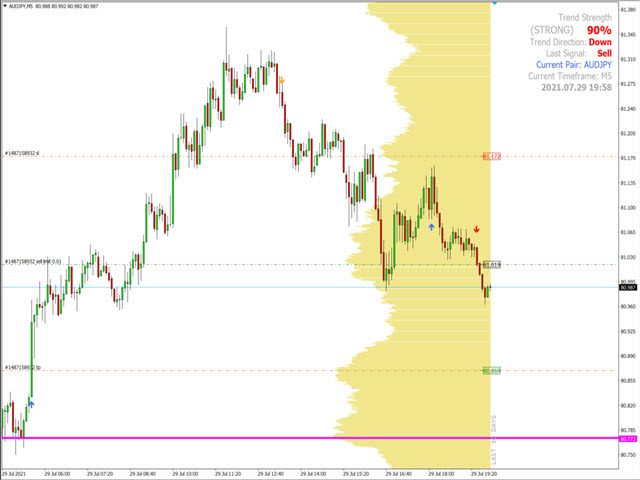
Trade like a professional with Winshots Massive FX Profits!
This indicator uses the following methodologies to help you become a more consistent profitable trader:
– MARKET VOLUME PROFILE
– DAILY LEVELS OF TURNS
– ANALYSIS OF PRICE CYCLES
What is a VOLUME PROFILE?
The volume profile is a very useful trading tool that many traders overlook – it allows you to determine the real price levels at which an important price action occurred. This is similar to the support and resistance levels, but with a different logic. Volume profiling shows the real levels of support and resistance at which institutional trading took place. No more guesses! You will know exactly when all the heavy trading took place with a large number of lots and volumes. The POC (Control point) of the volume profile will show you exactly where this happened by drawing a line on your chart. A POC is the node with the largest volume in the volume profile. The control point is the longest volume bar in the volume profile, and there are a lot of transaction volumes there. Professional traders use POC as a strong support and resistance or an important point of retesting.
[spoiler title=”Read More…”]
The volume profile (in some cases also called the market profile) is a convenient tool for checking the price movement on the chart. One of the first things that traders notice when analyzing the chart is the support and resistance levels. You can also use the volume profile for this. The volume profile not only allows you to determine significant support and resistance levels, but also highlights prices at which there was a strong price movement in the past (mainly by institutional traders).
Knowing that some prices have had important activity in the past can greatly help in setting up trades, stop losses and take profits for your future trades. The indicator scans the specified number of previous bars and calculates the volume of activity at each price level.
The result is presented as a vertical histogram – the longer the histogram, the more activity there was at this price level. You can configure the indicator to display the volume profile either up to the current, most recent candle, or up to some previous date.
What are the daily reversal levels?
A reversal is a significant price level known in advance (based on the trading activity of the previous day), which traders consider important and can make trading decisions around this level. As a technical indicator, the reversal price is also similar to the resistance or support level. If the reversal level is exceeded, it is expected that the price will continue to move in this direction or the price may turn around at or near this level.
What are price cycles?
Most successful Forex traders believe that the markets have a cycle. This cycle is the result of human behavior in the markets. As a result of this innate human behavior, market trends seem to be repeating themselves. If a trader can chart these trends and predict future movements, you can get rich! The most important part here is to recognize the different stages of market development and what stage you are at at the moment.
The Winshots Massive FX Profits indicator uses several methods to analyze the price movement and determine its price cycles. This analysis is performed separately on your chart whenever you switch to a new timeframe. This makes Winshots Massive FX Profits ideal for intraday scalping, as well as for trading on fluctuations.
With the help of the Winshots Massive FX Profits indicator, you can actually SEE with a high degree of probability what the next institutional step may be!
[/spoiler]