


“How nice it would be to have an indicator that tells you whether the price of an asset is trending or flat, allowing you to ignore false breakouts and market “noise” and focus on the real movement!”
“How nice it would be to have an indicator that tells you whether the price of an asset is trending or flat, allowing you to ignore false breakouts and market “noise” and focus on the real movement!”
Choppiness Index is a non-directional indicator for determining the flatness/trendiness of the market. It oscillates between -50 (very trending) and 50 (very flat).
The Choppiness Index indicator allows you to implement several strategies:
1. 1. Buy / Sell on a breakout when rebounding from extreme values of the Choppiness Index
- A move of CI below 11.8 (transition from flat to trend) after a rebound from a high CI value may indicate an approaching trend start (price confirmation is required)
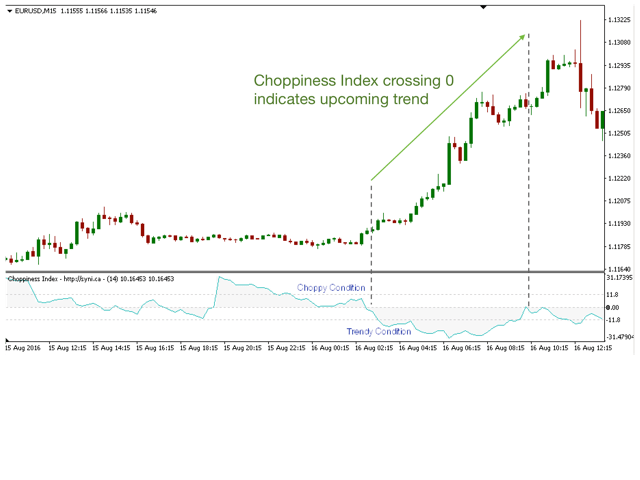
- With a more conservative approach, wait until CI passes 0 (shown in the screenshot)
2. 2. Following the trend (determining when to enter and when not to)
- If there is a trend in the market and the CI value does not exceed 11.8 more than three times, the trend is likely to continue. If CI crosses the 11.8 level three times or more, the trend is close to completion
[spoiler title=”Read More…”]
3. Increase the effectiveness of the trading strategy by confirming the current market conditions BEFORE entering the transaction. Many trading strategies are more effective under specific market conditions. Specify the required flatness/trendiness values using CI.
- Threshold values are usually used by the Choppiness Index indicator to determine flat / trend movements. Most commonly used are the well-known Fibonacci levels: 11.8 for the flatness threshold and -11.8 for the trendiness threshold
- The indicator works well in combination with trend lines and pattern recognition
Pop-up messages, audio alerts, and email notifications can be turned on/off for the following events. Please note that information about the email recipient and SMTP must be specified in the settings of MetaTrader 4 before using email alerts.
- Choppiness Index crosses the 0
- The Choppiness Index is above the user-defined upper (flat) threshold (default=11.8)
- The Choppiness Index is below the user-defined lower (trend) threshold (default=-11.8)
- CHOP period (Default=14): number of bars to calculate the indicator
- CHOP smoothing (Default=1): optional smoothing period applied to the indicator (may increase the loading time). 1=no smoothing, >1 = increased smoothing (the specified value is used as the smoothing period)
- Plot circles when CI > upper threshold: draw circles when the CI value crosses the upper threshold. If True, intersections are marked with circles
- Plot circles when CI < lower threshold: draw circles when the CI value crosses the lower threshold. If True, intersections are marked with circles
- Plot circles when the CI crosses zero: draw a circle when the value of the CI crosses the zero level. If True, intersections are marked with circles
- Turn on/off all alerts: True = alerts allowed, false = alerts suspended
- Alert when CI crosses 0: If true, alerts will be sent when the Choppiness Index value crosses 0
- Alert when CI is above upper threshold: If true, alerts will be sent when the Choppiness Index value is above the user-defined upper (flat) threshold
- Upper alert threshold (Default=11.8): User-defined upper threshold for alerts
- Alert when CI is below lower threshold: If true, alerts will be sent when the value of the Choppiness Index is below the user-defined lower (trend) threshold
- Lower alert threshold (Default=-11.8): User-defined lower threshold for alerts
- Turn on alerts message: Enable a pop-up alert
- Turn on alerts sound: enabling an audio alert
- Turn on alerts email: Enable email notifications
[/spoiler]