


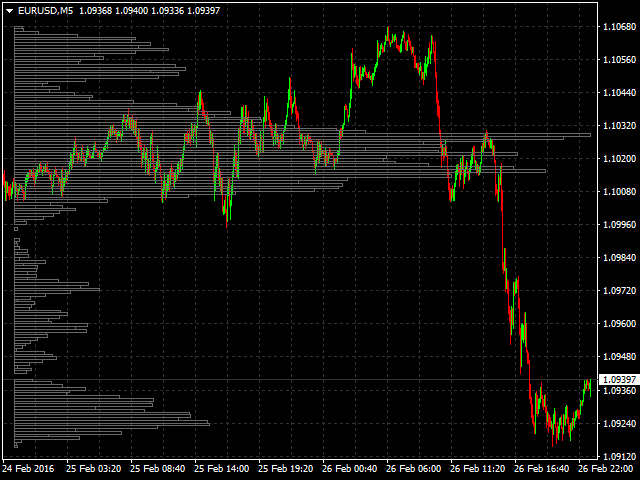

The indicator shows the conditional tick price volumes (levels) accumulated over a given period. For a more accurate calculation, data from the M1 graph is used by default. The step of distribution of price volumes is regulated. By default, the right border of the display is set to the bar corresponding to the beginning of the data used for analysis, but if necessary, it can be set to the bar you need. The length of the displayed volume bars (the right border) is also regulated by the length factor, and it can also be shifted to the left or right to 0 (the current) bar.
Parameters:
- Accumulation period – the period for calculating the accumulation of volumes
- Accumulation price step-the step of summing volumes by price parameters
- Graph length multiplier – the length coefficient of the displayed data
- Use data from timeframe – the chart used for analysis (timeframe)
- Graph show shift-the offset of the beginning of the data display, if you leave 0, it will show from the bar corresponding to the start time of the period of the analyzed data
- Graph color – the color of the indicator bars
- Rectangle lines style – the style of the border lines used to display the rectangle data
- Rectangle fill – fill mode (also a sign of finding data behind the graph).)
- Add object description-add price level data and volume values to the “description” of rectangles