


Technical Dashboard is a superb tool for analyzing several currency pairs as quickly as you can concerning the logical terms of simultaneous indicators from four distinct indicators.
the number of symbols that are exhibited is 30, the title of every symbol can be edited in the parameters, so you can analyze not only pre-determined currency pairs, but other instruments, such as commodities, stocks, indices, currency pairs together with prefixes and suffixes, etc.
The app can send alerts via the MetaTrader terminal, push notifications into a mobile device, as well as email alerts, for example, from a VPS. You can enable/disable each type of alert type (alerts, push, by e-mail).
The Technical Dashboard program is based on 4 technical indicators:
For each of the indicators, you can set the maximum and minimum levels (for ADX, this is the maximum and minimum values). You can also set a period for the ADX, RSI, and MFI indicators. The condition to trigger the alert will match the following indicators from the indicators: the ADX value is between the minimum and maximum value of the ADX, the value of RSI is below minimum RSI (for buying) or above the level of the RSI (for sale), the value below AO below AO level low (for buying) or above the maximum of AO (for sale), and the MFI value is below the low level of MFI (for buying) or above the level of the MFI (for sale).
[spoiler title=”Read More…”]
You will receive an alert/push notification / email only if all 4 conditions for the selected pair match in the selected time period in one direction:
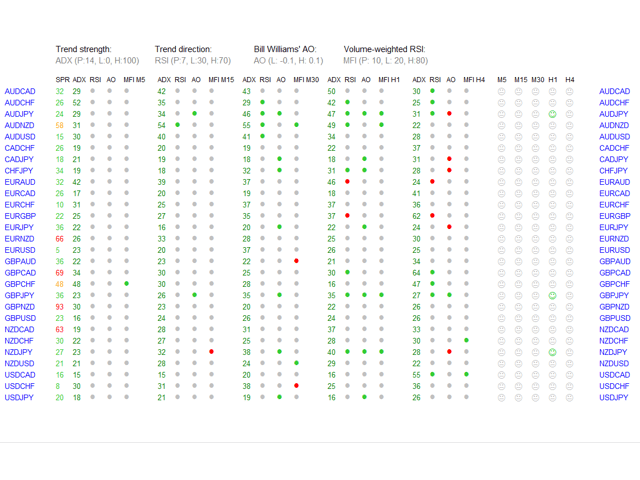
The green and red dots on the panel indicate whether the conditions for the specified indicator, currency pair, and timeframe are the same. Green dots indicate oversold (buy), red dots indicate overbought (sell). If the ADX indicator is between the minimum and maximum value (the value is green, otherwise gray) and 3 points (three indicators) are green or red for a particular currency pair and timeframe, a green or red smiley will appear on the right side of the panel. This means that the signals from all indicators are consistent.
If the parameter “Use_Only_Closed_Bars” is set to “True”, alerts will be generated after the bar formation is completed. If the parameter is set to “False”, alerts will be sent immediately without waiting for the candle to close.
There are five timestamps available in the panel from which you can receive alerts: M5, M15, M30, H1, H4.
The panel header displays all the parameters of the four indicators.
You can also specify the maximum spread at which notifications will be received (“Alerts_Max_Spread”).
Spread values are displayed in different colors on the panel:
- a) values below or equal to “Alerts_Max_Spread” are displayed in green,
- b) values 1-1. 5 times larger than the parameter are shown in orange,
- c) more than 1.5 times the parameter is shown in red.
I recommend that you create a new template in the new chart window with a single indicator “Technical Dashboard”with a color scheme without colors (“None”), with a background (“White”) and foreground (“White”), and save this template.
Remember, no one else is responsible for any investment decisions you make.
You are responsible for your own investment research and investment decisions.
Good luck!
[/spoiler]