


The product is an analog of the Tick volume analizer Expert Advisor, but it is made in the form of an indicator. The need to release a new product is caused by the fact that the use of two Expert Advisors in one window is not allowed.
The tick volume is equal to the number of ticks per unit of time. There is a direct relationship between the tick volume and the actual number of transactions. Each price change is caused by a real transaction request. Therefore, the fewer requests, the fewer price changes, and as a result, the smaller the tick volume.
In the case when a large number of requests appear on the market, there is a more frequent change in prices. A large tick volume appears. Tick volume is an important intraday indicator of trading activity in the market. The increase in tick volume allows you to determine the moment of increased interest in the price on the part of traders and indicates the desire of the market to actively trade.
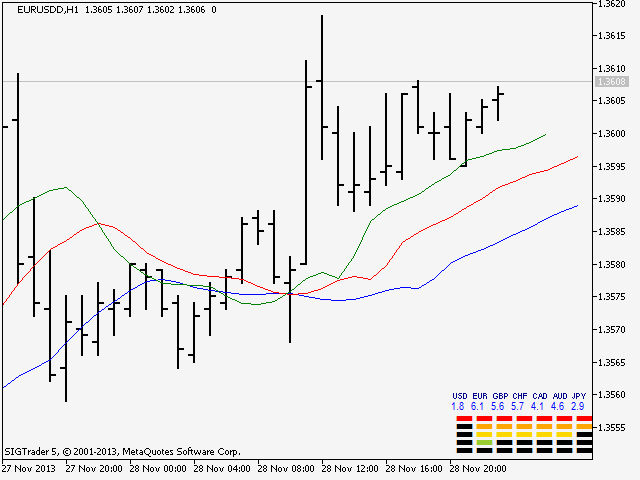
The proposed analyzer allows you to monitor both the tick volume indicator and the real volume indicator for those instruments that have it in real time. The indicator displays information in the upper-left corner of the chart in the form of columns indicating the level of interest from traders to the instrument and the price at the moment.
[spoiler title=”Read More…”]
Readings from 0 to 2 – the currency is extremely weak. Most traders sell it. You should get rid of the currency. If the market is calm and neutral, the indicator readings are in the range from 3 to 6. Values above 6 indicate increased interest in the currency.
The smaller the column, the less interest in the tool. A high bar and a reading above 7 indicates a high interest in the price and the currency it represents. If the tick volume (volume) indicator exceeds the value “7”, an audible signal sounds, and a window with a visual signal pops up. This suggests that a “driver” has appeared on the market with increased interest in himself.
The bar readings easily allow you to determine which currency to trade on and which currency to get rid of. If, for example, the AUD column turns green, and the readings become more than 7, and at the same time the USD reading is less than 2, then you need to look for entry points to a long position in the AUDUSD pair.
The readings usually change at the beginning of the European session, at the height of the American session, and at the close of the trading day.
The analyzer will be a great addition to any of your templates and indicator sets. It will confirm or deny your desire to enter a position on a particular instrument. It will be a good assistant for intraday traders.
[/spoiler]