


An indicator with a voice alert. Works on custom trend lines (maximum 10 trend lines of each type). It works on all timeframes and symbols. Signals are generated when the price enters the lower or upper price area of the user trend line, and are closed when the price exits.
Trend lines are drawn manually by the user. They can be horizontal (including at an angle) support/resistance lines. Each trend line must be given a name in the input parameters. The indicator can use up to 10 ascending or descending trend lines. The names of the lines are specified when they are added to the chart and must match those specified in the input parameters an ordinal number from 0 to 9. For example, if the ascending trend line is called tlup, when they are manually drawn on the chart, they must be called tlup0, tlup1, …, tlup9. The same applies to descending trend lines. If their common name is tldown, the lines on the chart should be called tldown0, tldown1, …, tldown9.
The trend price area lines are built automatically, initially based on the selected settings (ATR, percentages or points). After that, they can be configured manually. To do this, click the Manual Price Band button (the background color of the button will change from red to green and the lines of the upper and lower trend areas will be activated) and, using the middle anchor point of the lower or upper line of the area, move them with the mouse to the desired distance from the trend line. The price area lines will move immediately after the first tick appears on the chart. When you click on Auto Price
Band lines of price areas are redrawn automatically when the first tick appears (ATR, percentages or points). The price area lines are also automatically redrawn when the first tick appears, if the trend line has been redrawn/moved manually. The Manual Price Band and Auto Price Band buttons can be moved with the mouse after selecting them.
[spoiler title=”Read More…”]
A buy signal is triggered when the minimum or closing price of the previous bar is in the upper price area, and the current bar closes above the maximum limit of the upper price area. A buy signal is triggered when the maximum or closing price of the previous bar is in the lower price area, and the current bar closes below the minimum limit of the lower price area.
The strategy is simple: draw up to 10 trend lines manually (they can be horizontal support/resistance lines) and name them as mentioned above. Add the indicator to the chart and open a buy order when the corresponding signal is triggered (up arrow on the chart). Open a sell order when the corresponding signal is triggered (down arrow). When making trading decisions, the indicator is recommended to be used together with other indicators, candle patterns, etc.
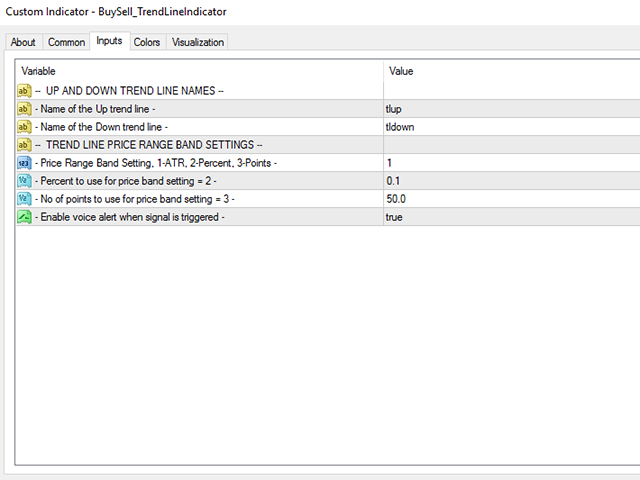
Main settings – names of trend lines
- Name of the Up trend line – name of the up trend line (by default tlup)
- Name of the Down trend line – name of the descending trend line (by default tldown)
Trend Line price range band settings (settings of price areas of the trend line)
- Price Range Band Setting – setting the price area lines. Possible values: NO Band – do not draw price areas, ATR – price areas based on ATR, Percentage – price areas based on the number of points, Points – price areas based on percentages (default ATR Price Band)
- Use Auto or Manual Price Band – use automatic or manual price areas (Auto by default)
- Percentage to use if price band setting selected = 2 – percentage value of setting the price area lines (0.1% by default)
- No of points to use if price band setting selected = 3 – the number of points to use with the price area line setting (50 by default)
- Enable voice alert when signal is triggered – enable voice alert when the signal is triggered (true by default)
George Kosoveanu
[/spoiler]